Updated November 11, 2020
What are data lineage diagrams?
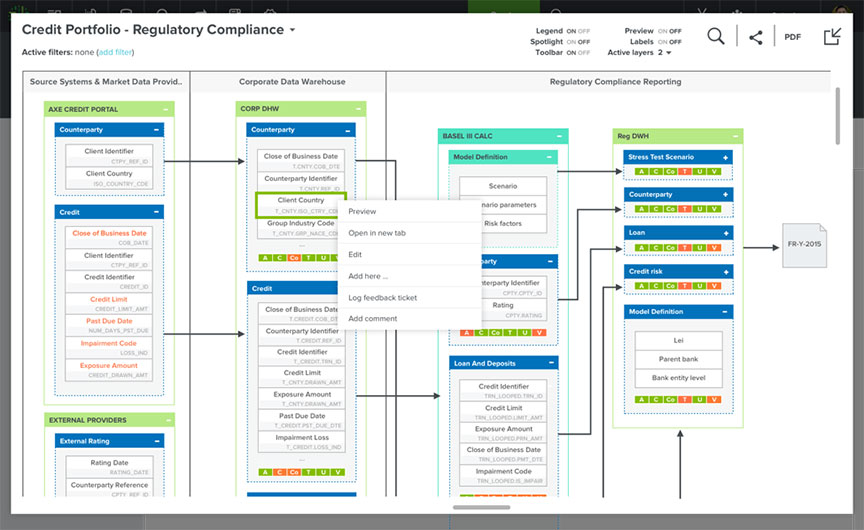
Data lineage diagrams show how data transforms and flows as it is transported from source to destination, across its entire data lifecycle. A business lineage diagram is an interactive visualization that shows summary lineage of how data flows from data source to report without surfacing all the technical details and transformations. In contrast, a technical data lineage diagram allows information architects to view transformations, drill down into table, column, and query-level lineage, and navigate through data pipelines.
Data landscapes today and why it’s a problem for an information architect
Many companies – especially in Financial Services, Healthcare, and others – have a hugely scattered application landscape. From front to back office systems, over several data warehouses, organizations have many local and global single points of the truth and a vast diversity of business information reporting tools ranging from plain good-old MS Excel to the more popular BI tools like Qlik and Tableau.
An information architect (also known as a data architect) is responsible for bringing clarity to this gigantic spider web of data sources, systems, files, interfaces, processes, data warehouses, regulatory reports, internal management report, public shareholders disclosures, and dashboards, as well as the more diverse big data lakes and systems. And very often, none of these systems are adequately documented, and even if there is documentation, it is often outdated.
The trend with cloud data warehouses, software-as-a-service, big data, and the internet of things is certainly not going in the direction of the consolidation and centralization of multiple data sources into one single data location. Instead, it is quite likely that our current spider web will just grow and grow, and therefore, the problems IAs face today will only become bigger tomorrow.
How an IA tackles these problems today — and why it is not working
So how does a regular information architect tackle this challenge to create a nice, easy-to-navigate, easy-to-understand, easy-to-maintain, easy-to-document, and more importantly, easy-to-consume architectural picture of this application and data chaos? And how do they do so when faced with time pressure to comply with demanding regulations like GDPR, BCBS 239, CMS, and others?
Well, probably one step at a time and one data flow at the time. But what’s the starting point? Do you start at the end with the reports? But which reports first? For financial institutions, it makes sense to start with your compliance report models (ex. the European Data Point Model). Healthcare institutions might start with the systems that provide an adequate picture of patient history. For other industries, it will be another starting point for sure. A popular approach is to use a Critical Data Elements methodology.
So first our IA will spend numerous days, weeks, and months investigating and talking to the different SMEs of all those different systems and business processes. He will capture all of this information and write it down (in another file somewhere on the network).
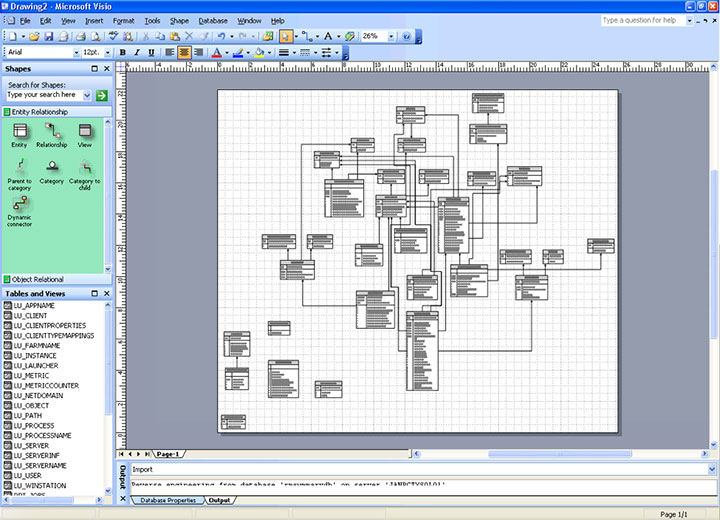
Source: Using Microsoft Visio to Reverse Engineer a Database
As a next step, our IA will pick one stream and he will design an elaborate architectural picture of different systems and applications interacting with each other, including how the data flows from these systems to the different data warehouses and how the data warehouses feed the different reporting tools and how those tools produce hundreds of reports. Hopefully he will use supporting classical data lineage tools as there are many on the market to automate some of that work.
Next, our IA will publish these architectural diagrams and will distribute them in a read-only PDF format to the different business users and analysts within different departments. Ultimately he will find out that nobody uses them. Why? Because everybody has a different background and a different vocabulary (business versus technical language), a different need for granularity of information (management wants a high level picture, a mortgage loan specialist is looking for a more detailed picture, auditor wants to see it all and be able to go into the nitty gritty details). Even the DBA needs to understand the context for data.
Unfortunately, in the end a lot of time, effort and money is spent on designing good looking architectural pictures, which – understandably – do not accommodate everybody’s needs, quickly become outdated, and never hold the level of detailed information and documentation that is required.
And even when the architectural pictures are good enough, the consumers are faced with the traditional governance challenges:
- Where can I find them?
- Who owns them?
- Who maintains them?
- Who can help me explain them?
- Are they still up-to-date?
Clearly the current approach isn’t working.
Collibra Data Lineage enables organizations to better understand their data
Collibra has the solution for all IAs, CIOs, and CDOs who need to sponsor and are, in the end, accountable for a properly managed, documented, and controlled IT landscape. Before Collibra Data Lineage, IT spent countless hours manually building mappings and keeping track of data lineage in various tools. They also had to keep the mappings up to date, which takes a massive amount of time, especially for enterprises with large amounts of data that is scattered across databases and systems. This manual process can also lead to inaccuracies and human error. Collibra Data Lineage solves this problem by automatically extracting lineage from various source systems and keeping it up to date. This saves 95% of IT’s time and frees up resources to focus on strategic initiatives.