Why we use Collibra Data Notebook every day — and how it helps us build better products

At Collibra, we sip our own champagne (every day). This concept — also known as “eating your own dog food” (gross) — means we actually use our own product. Not just for demos. For real work. Every single day.
As a Product Data Analyst (and proud Data Citizen), I sip that champagne daily — and it’s genuinely good.
Two reasons:
- It actually helps me do my job.
- I’m basically our target customer — so using it gives us honest, practical feedback we can build on.
What does “drinking our own champagne” look like?
One of the tools I use the most is Collibra Data Notebook — think SQL playground on steroids.
It lets you:
- Write SQL
- Visualize your results (with beautiful charts)
- Add documentation and context
- Share everything with your team
The magic part? It’s built on top of the Collibra platform, so you can quickly view useful details like schemas, column descriptions and ownership information without leaving your notebook.
That means I don’t have to go hunting for metadata or open three tabs just to write a join. It makes writing SQL on the go a lot easier — and it dramatically decreases time to insight.
We use Data Notebook every single day. To explore data, answer product questions and create insights that help us make better decisions.
Each notebook is like a mini story:
You start with a question or a hypothesis — sometimes it’s yours, or sometimes a stakeholder kicks things off by dropping their questions right at the top of the notebook. That becomes the business goal. From there, you write a few queries, add some commentary and plot a few charts. Ideally, you answer the original questions. Sometimes you end up with better ones. That happens too.
Once published, a notebook becomes an asset that anyone at Collibra can access, share and collaborate on (as long as they have the right permissions) — just like any document.
How we use Data Notebook at Collibra to make product decisions
Here are two concrete examples of how we use Data Notebook internally at Collibra. We’ll show how we quickly explore data, validate assumptions, reduce time to insights and drive product decisions.
Example 1: Understanding Collibra AI Copilot usage
We recently announced Collibra AI Copilot, an intuitive chat experience with Collibra that helps users answer data questions like: “What dataset can I use to report on ARR?” or “How is ARR defined?”
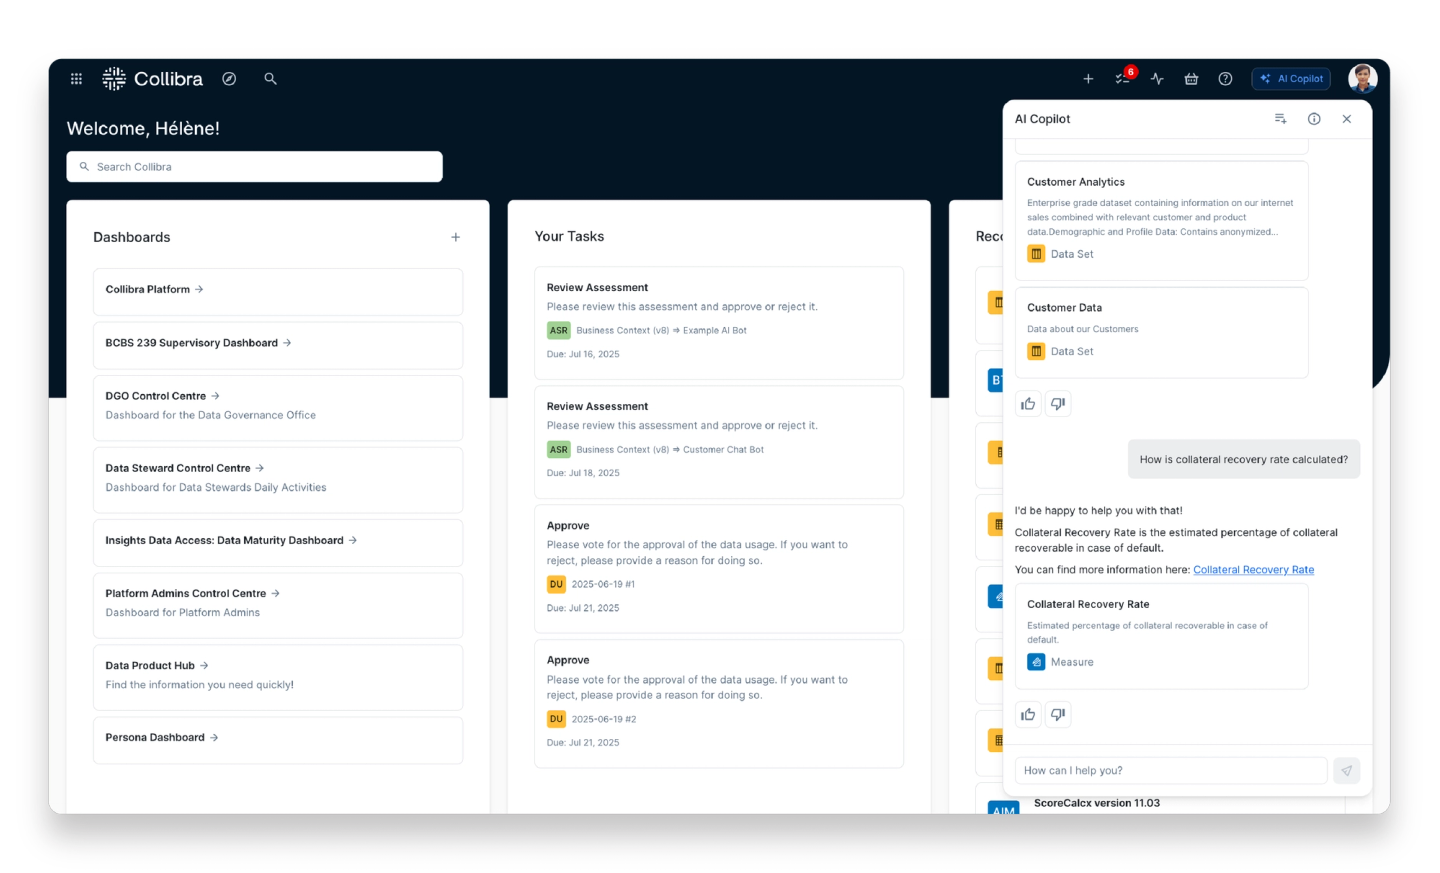
User interacting with Collibra AI Copilot from the platform’s homepage interface
Before releasing it to a wider audience, we ran a private preview with customers — and tested it internally, too.
Naturally, we had some questions including are people actually using it? And do they like it?
So, we opened a Data Notebook and started digging.
We tracked usage over time with SQL, visualized the trends directly in the notebook, and gathered insights from early adopters.
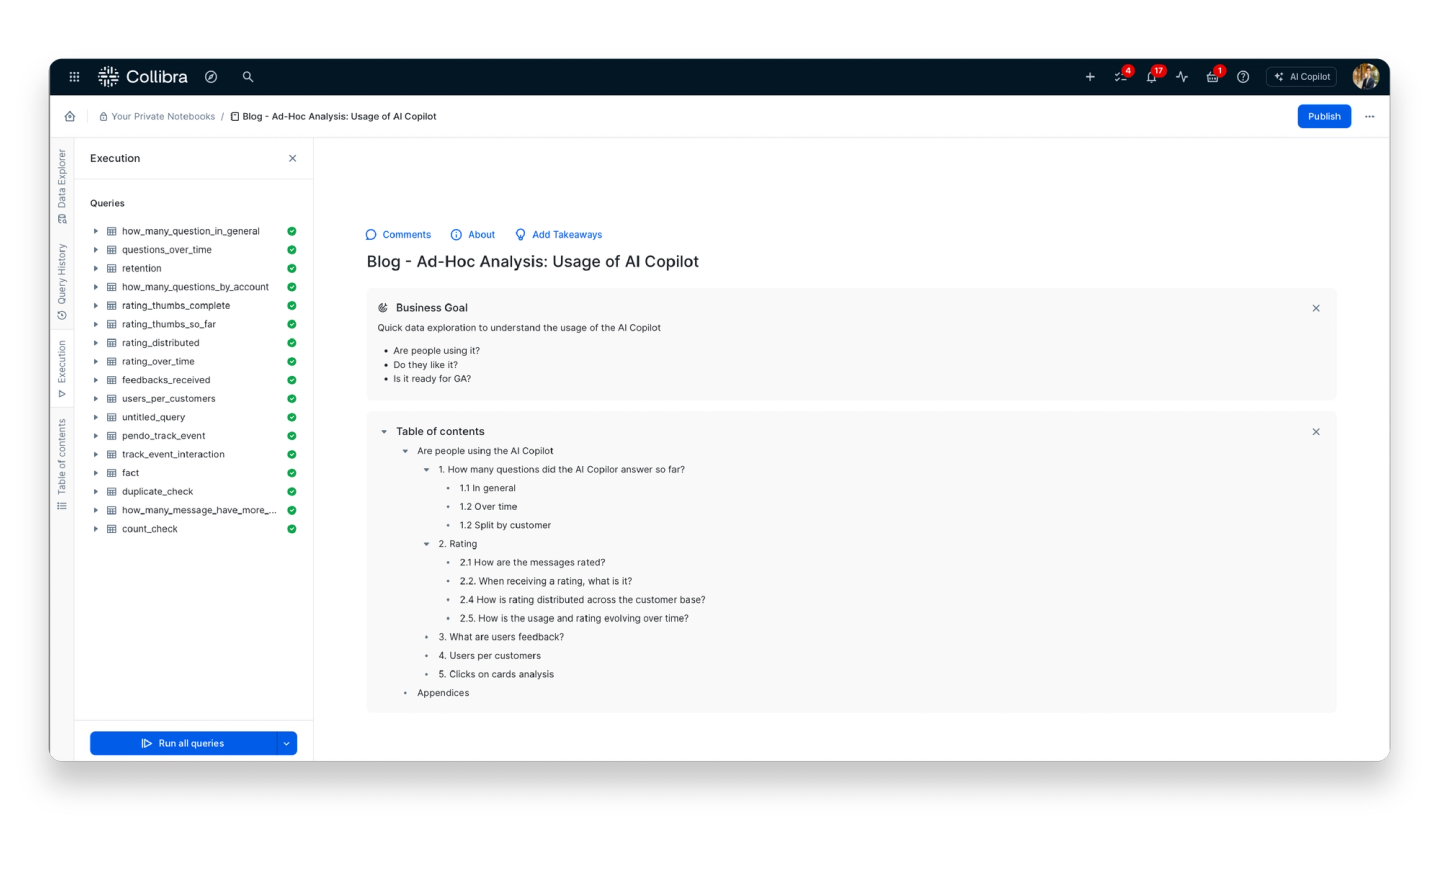
A data notebook displaying the business goals and notebook table of contents for ad-hoc analysis around the usage of Collibra AI Copilot, alongside the query history
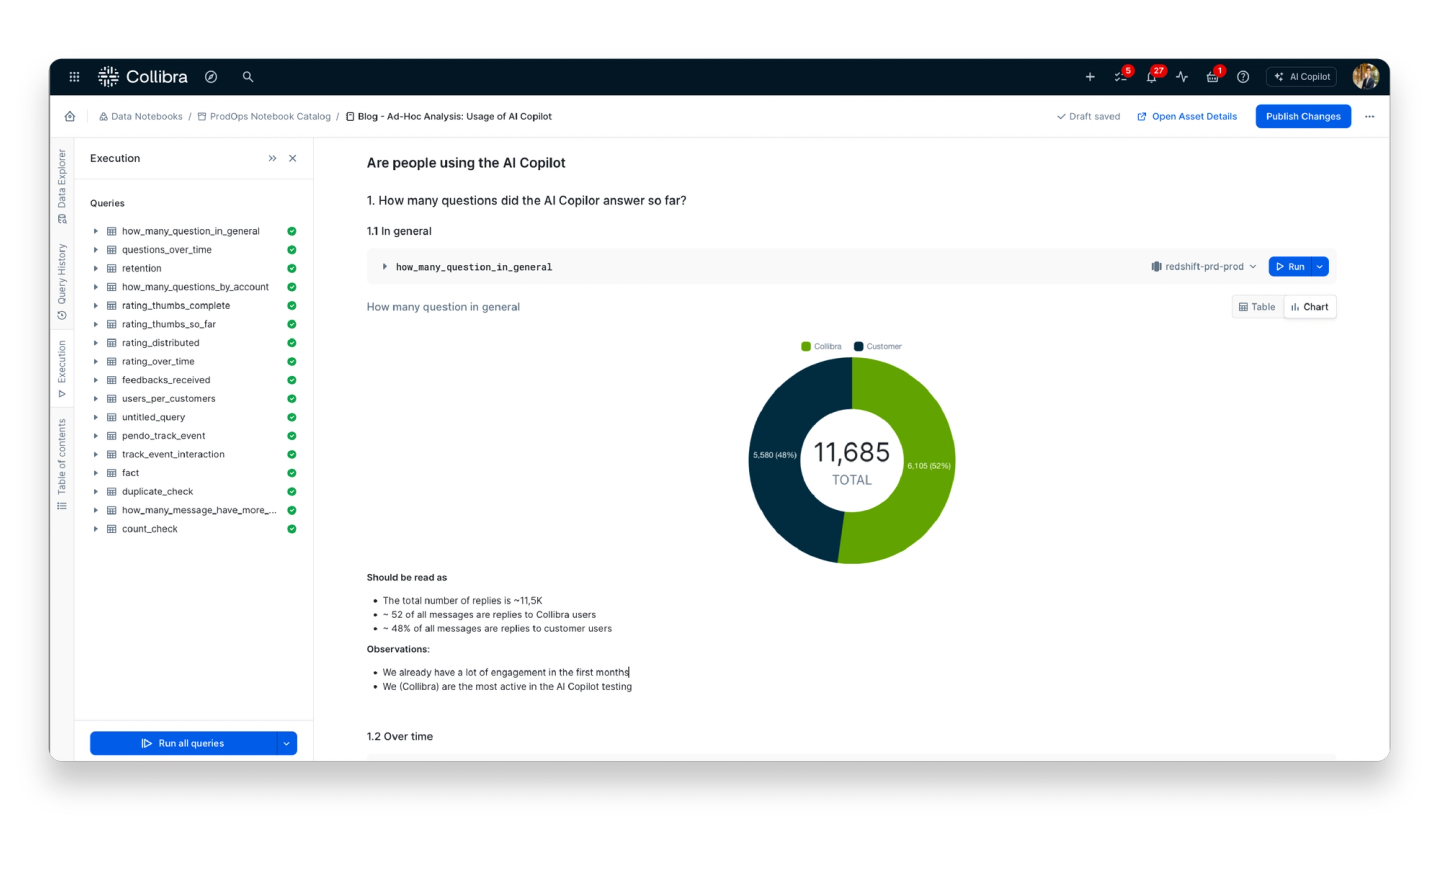
A chart showing the breakdown of internal and external users of Collibra AI Copilot during the private preview, with a summary provided below
If you look closely at the question_over_time query, as shown below, you’ll see it pulls from a table called fact — a base query we reused multiple times across the notebook.
That’s one of the things that makes Data Notebook so powerful: you can reference queries inside other queries, like dbt models, but without all the YAML and overhead. Under the hood, it just chains everything together using Common Table Expressions (CTEs) that you can reuse anywhere else.
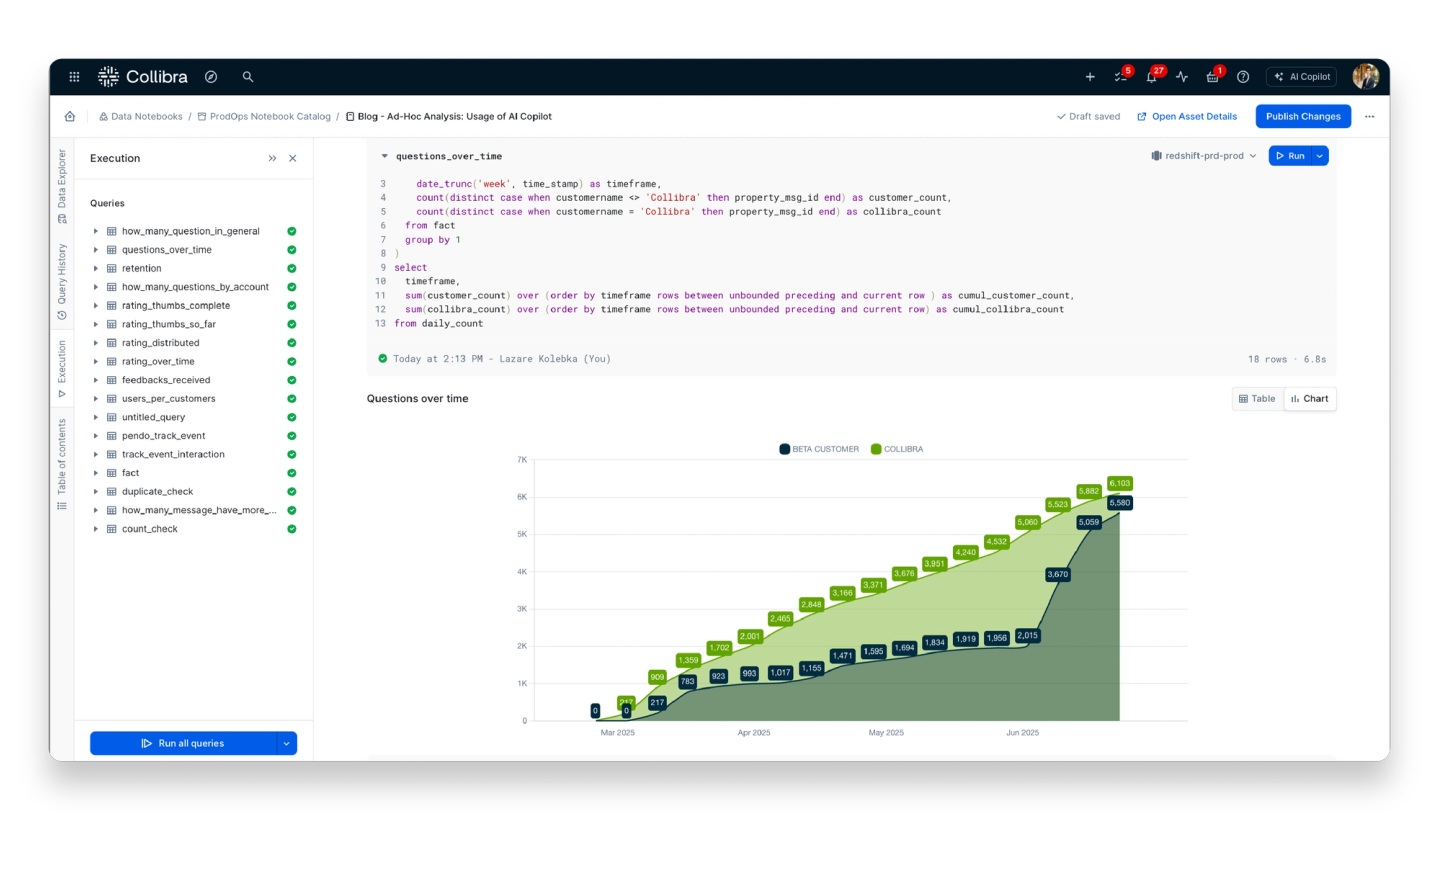
An additional chart showing the number of prompts from internal and external users of Collibra AI Copilot during the private preview below the detailed query.
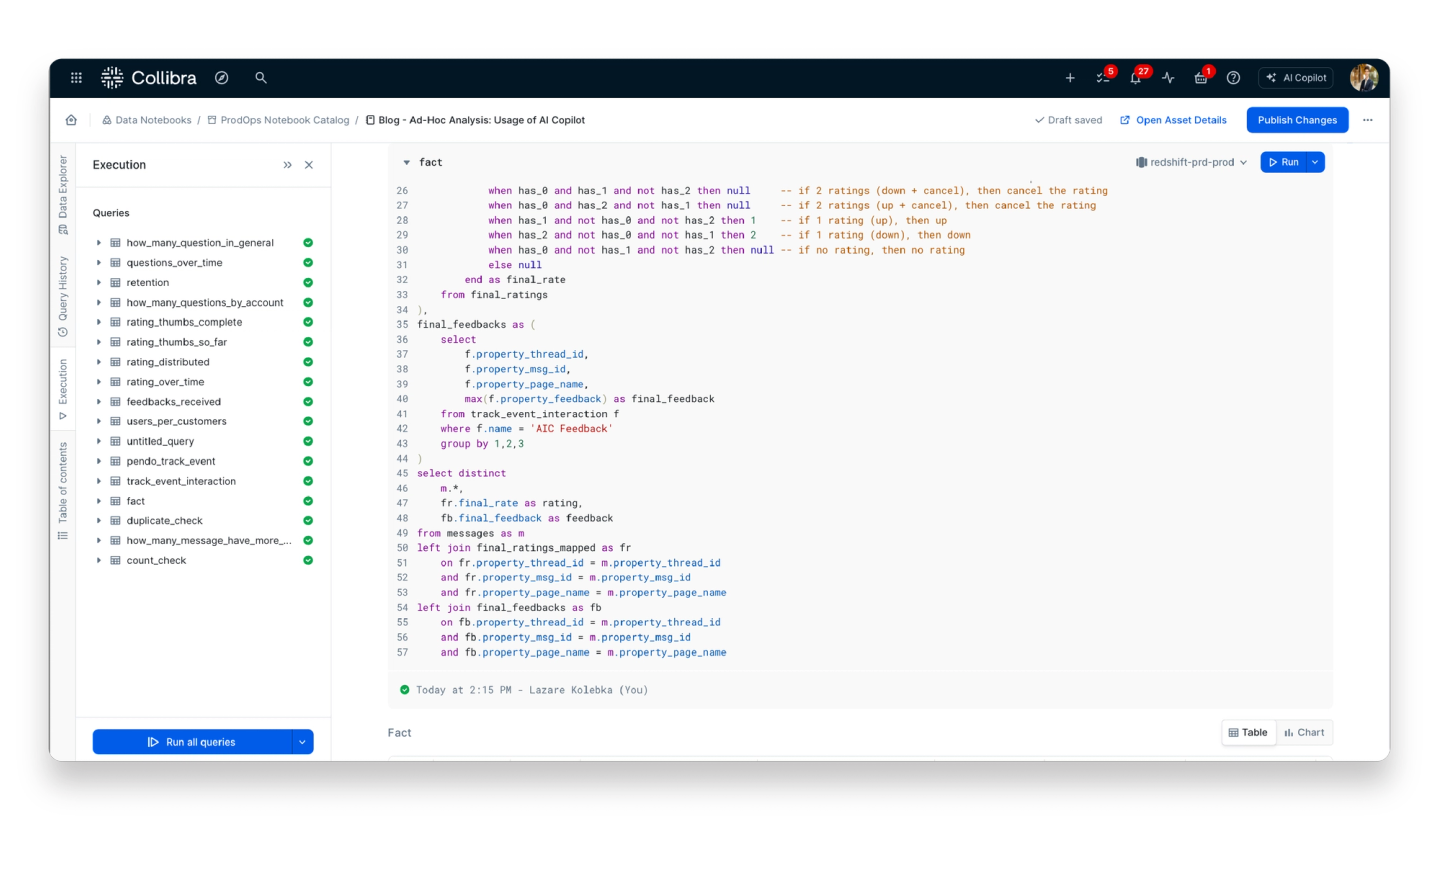
A base query referenced as the fact table that has been reused multiple times across the notebook
Sometimes a notebook outgrows itself
Data Notebook is amazing for ad hoc analysis — for exploring ideas, testing assumptions and answering one-off questions.
But sometimes, an insight gets enough traction that it shifts from analytics to reporting. At that point, it deserves a more robust home.
That’s when we scale.
We usually take one of three paths:
- Move to dbt, and turn our logic into a production pipeline
- Send it to Tableau, and build a dashboard around it
- Or both — dbt first, Tableau after (in most cases)
If we’re going the dbt route, we wrap it into a transformation pipeline, often copy-pasting the queries directly.
If we need a quick Tableau proof of concept, we just export the full SQL from a notebook block — it’s already cleaned and structured with CTEs. Just plug and go.
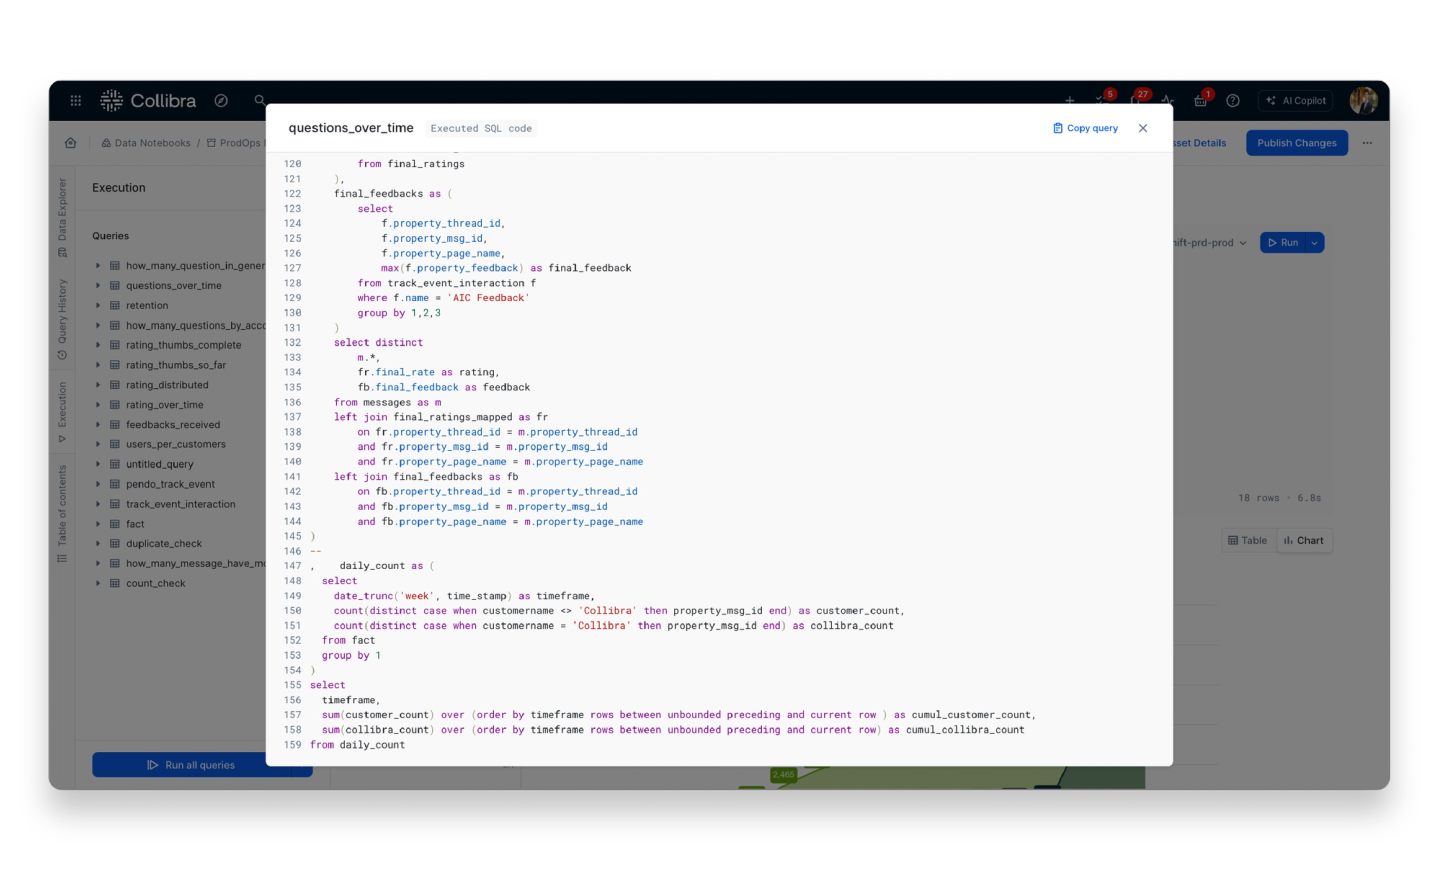
Complete CTE of questions_over_time, ready to be imported into dbt or Tableau.
What we learned from the AI Copilot analysis
Here are three takeaways from the notebook we built around AI Copilot usage:
- Users are embracing the chat experience. Engagement with the chat interface (along with feedback) was high from day one.
- Model A didn’t deliver. Based on early feedback, we moved from Model A to Model B — and saw significantly better results.
- There was demand across teams across the organization. Other teams wanted a clean dataset and dashboard, so we moved it into dbt and Tableau: we made a clean dataset so that anyone can query it and also published a Tableau dashboard.
The notebook allowed us to move quickly, surface early insights and adapt in real time.
When it was time to scale, everything we needed was already written.
Example 2: Helping the UX Research team make data-driven decisions
Asset diagrams in the Collibra platform just got a fresh look and feeI, allowing users to have a seamless and consistent user experience across the platform. Functionally, the diagrams let users visualize the flow of their data assets, which is super useful.
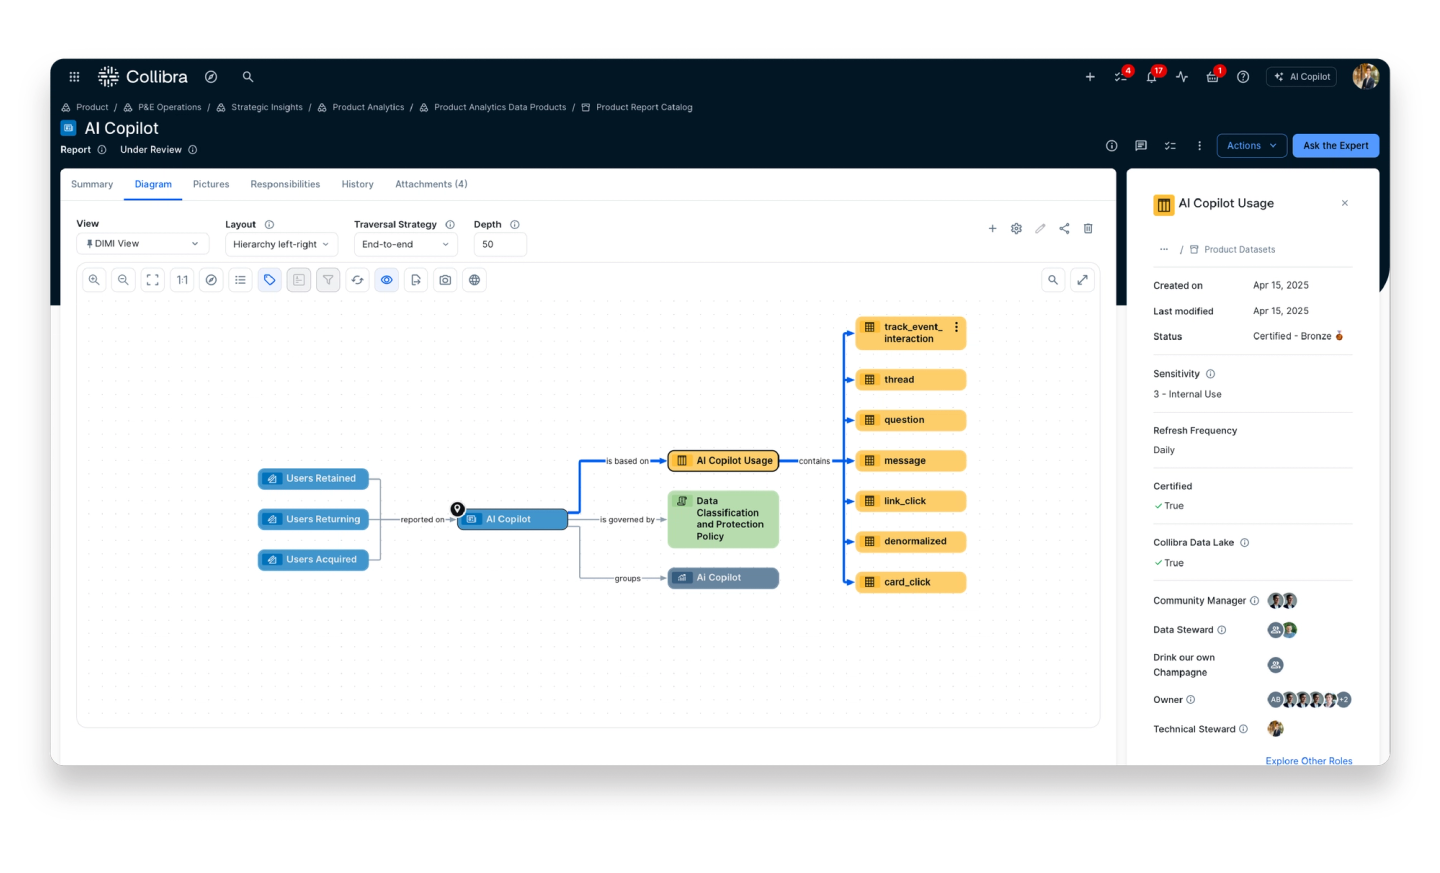
Example asset diagram in Collibra
The UX team is continuing to research how users interact with the diagrams UI to further improve the experience. For instance, they recently wanted to know which buttons in the UI get used most frequently.
To figure that out, they needed data. So, once again, we opened a notebook.
To kick things off, within the notebook we:
- Set the business goal
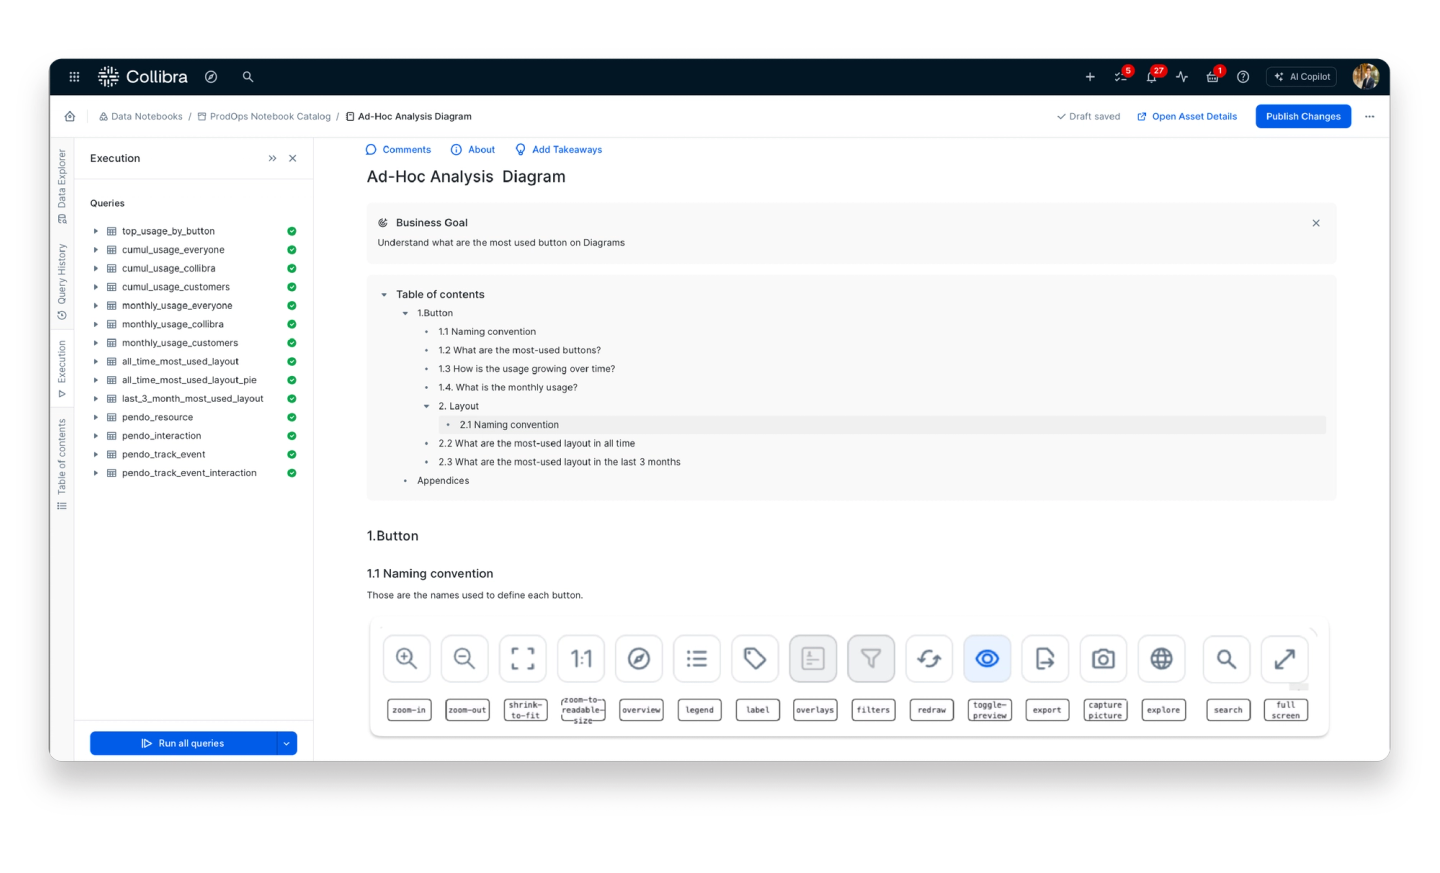
- Added clear naming conventions (so my colleagues in UX could follow)
- Included context, table of content sources and logic at the top of the notebook
A data notebook displaying the business goals and table of contents for ad-hoc analysis around business diagram buttons
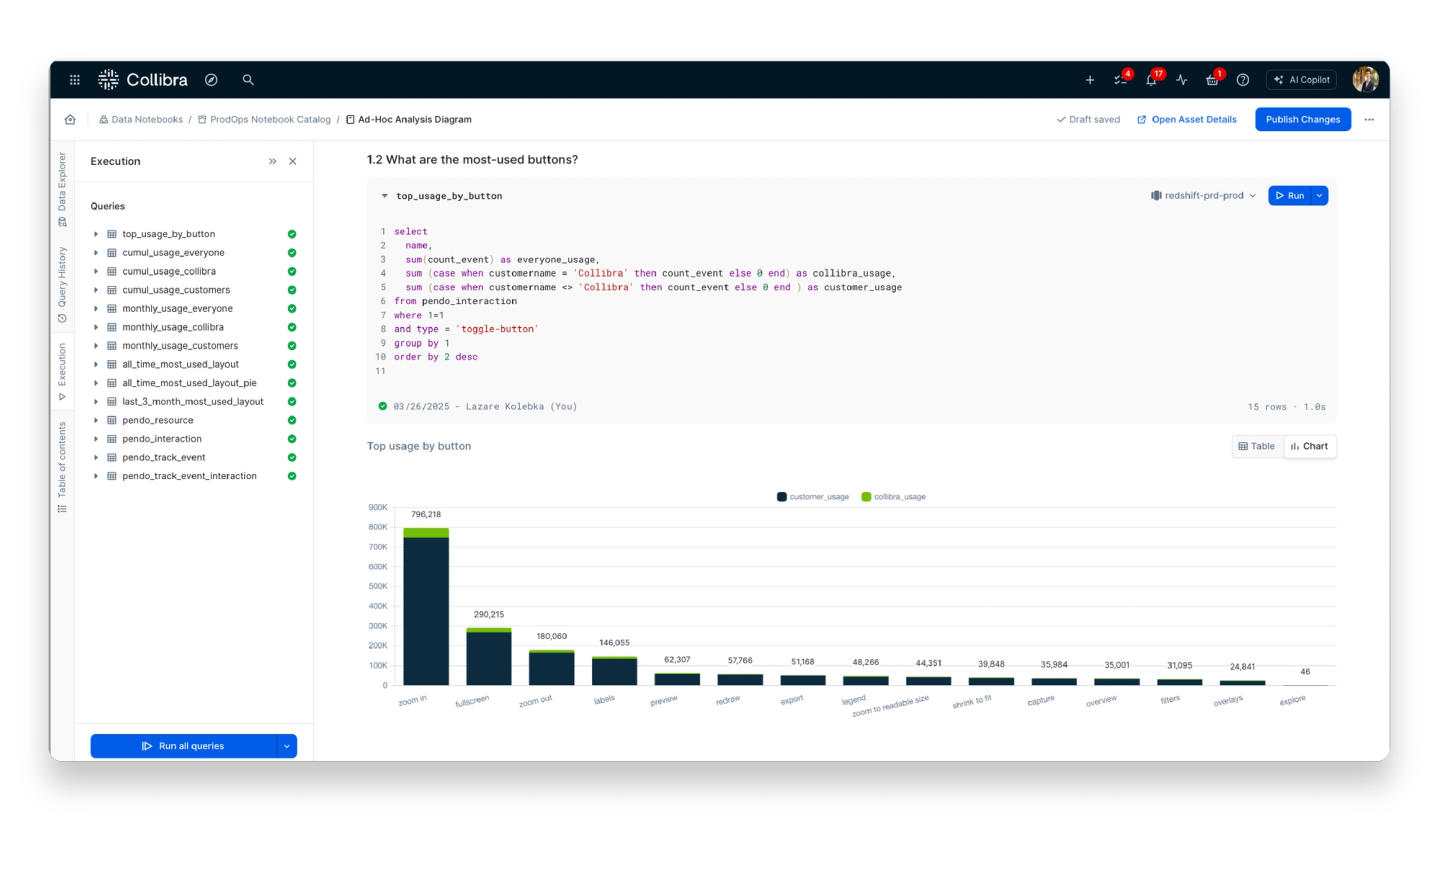
Once the data was organized and transformed, the actual analysis was light — we just queried button usage and sorted by volume.
We added a chart — not because SQL wasn’t enough, but because visuals make it easier to make decisions fast.
A query and chart showing the most used diagram buttons by internal and external users
The results
Top-used buttons:
- Zoom in / Zoom out / Full screen (navigation)
- Label / Preview / Redraw (core diagram actions)
This gave UX Research the data they needed to understand real usage patterns — to shape design priorities based on evidence, not assumptions.
And if anyone wants to dig deeper, they can. Everything’s there in the notebook: source tables, logic, definitions, queries. No mystery math.
And because the notebook is a published asset, it’s searchable in the data catalog. Meaning anyone interested in this topic can request access or reuse some or all of the code.
Takeaways
We use Data Notebook every day to explore data, validate product ideas, and move fast — without waiting on dashboards or specs.
It helps us stay transparent, share logic across teams, and scale insights when the time is right.
If you want to learn more:
- View the Data Notebook demo video
- Take Data Catalog product tour featuring Data Notebook
In this post:
Related articles

Data GovernanceApril 17, 2025
Strengthening data reliability at WGU through smarter governance

PartnerJanuary 26, 2024
Collibra is proud to be part of the Snowflake Horizon Partner Ecosystem

Data CatalogMay 22, 2023
Facing your data challenge with a data catalog

Data CatalogAugust 25, 2025
How to build a data catalog: Step-by-step
Keep up with the latest from Collibra
I would like to get updates about the latest Collibra content, events and more.
Thanks for signing up
You'll begin receiving educational materials and invitations to network with our community soon.
