


Related resources
How much is my data product worth?
Share on:

How much is your data worth?
The same question arises over and over again, “what is the value of our data products?” Our team can try to answer this question by tracking estimators such as usage and consumer metrics. The truth is – no one really knows what a data product is really worth.
Mike Ferguson, Managing Director of Intelligent Business Strategies Limited, explains that the term ‘data product’ is used to describe everything that provides insights from data. Including anything from virtual data assets to SQL queries to reports and APIs – and everything in between.
Once you’ve factored in all the tangible measurements, you can’t ignore the abstract influences. An essential criterion to valuing a data product is to determine if the data team’s resources were used effectively.
It is true, it is a lot of effort to calculate the value of your data product. If you measure as many costs and components as you are able it is well worth the effort. An effective data product leads to accurate decisions.
We recommend starting with a specific and popular data product within your organization. In this blog my team shares our experiences and the steps we took to determine the value of one of our data products.
Kickstarting the research
We kickstarted the research by focusing on a specific data product called the Data Intelligence Usage Dashboard. It is a dashboard that helps our sales engineers understand how they can guide users through a Collibra proof-of-concept (POC). If used correctly, the sales engineers can improve a customer’s user experience and satisfaction during a POC.
As a first step, we estimated the cost of all the resources that the data product consumes, then we calculated the total value that this data product is returning to our company in revenue. Finally, we evaluated how profitable or unprofitable this data product is. In image 1, you can see the general model for valuing the data product.

1. Costs
The first step to evaluate the cost of a data product is to identify which resources the data product uses. In image 2, you can see the costs of the Data Intelligence Usage Dashboard in its first six months for each cost parameter.

1.1. Amazon Web Services (AWS) cost
Several AWS services are used when creating the Data Intelligence Usage Dashboard. In this example, the raw data is stored in S3 buckets, EC2 is used for cloud computing, and Redshift is used for data warehousing. In image 3, you can see which Amazon Web Services are used to create this data product.

There are many data products at Collibra that utilize the same architecture as the Data Intelligence Usage Dashboard. As a result, it can be challenging to calculate the cost of each component within the architecture and identify the fraction of the costs that should be attributed to each data product.
To simplify the problem, we allocated the costs based on runtime with the assumption that every unit of runtime consumes the same amount of resources. In image 4, we describe the resource allocation assumption in this research.

Using this model, we can calculate the cost of S3, Redshift and EC2 for the Data Intelligence Usage Dashboard.
1.2. Creation cost
The creation cost is the cost (of ownership) for all people involved in creating the data product. In this case, we needed the help of one data scientist for designing and implementing the data product, one data engineer to build, test and maintain the data pipeline architecture, one pre-sales engineer to ensure the data product is meeting their needs, and two senior managers for giving feedback.
1.3. Maintenance cost
Maintenance cost is the cost of modifying a data product after delivery to correct faults or improve performance. In the case of the Data Intelligence Usage Dashboard, the maintenance cost is the cost of people who are working to maintain this data product once it has been delivered. Since this data product rarely fails, the maintenance cost is minimal.
1.4. Tableau license cost
The company has to buy a Tableau license for all the people who create or view this dashboard. On average a Sales Engineer uses 22 dashboards, which helps us allocate a part of the cost.
2. Revenue
In the second step, we aimed to measure the revenue for the proof of concepts in which sales engineers have used this data product. This value can be difficult to define. Some options are to look at the number of views on the data product, or calculate the value of deals closed per user of the data product. We decided our best approach was to survey the sales engineers about how much they value the dashboard.
They all agreed: “This data product helps us but it’s a tool that only supports the process. It only contributes to part of the value created.” Therefore they estimated the attribution rate to, on average, 4%. Meaning that 4% of the revenue from closed deals generated in the past 6 months could be attributed to the existence of this data product.
3. Net Value
After calculating the costs and revenues based on the assumptions made in the previous sections, we subtract costs from the revenue and evaluate the data product net value.
If the result of this subtraction is positive, the data product is beneficial for the company and we can keep it as is or improve it further. If the result is negative or equal to zero, it means that the costs of this data product are equal or more than the revenue, and the data product is not worth it. So, we have to search for the weaknesses. Some areas to investigate are whether the data product needs improvement, or if there is a need for enablement within the company. If the data product is not being used, it is not providing value.
Conclusion
A profitable data product can help a business make the right decisions and eventually drive revenue. An unprofitable data product adds cost and drains resources of the organization. It should be modified so that it becomes profitable. If this is not possible, it is better to sunset the data product. Hence the importance of the monitoring step in the 8 step process to create a data product; the monitoring phase establishes whether the data product can be kept as is, enhanced, or decommissioned.
Based on the analysis done in the previous sections, there are two possible ways to increase the net value of a data product: reducing the costs and/or increasing revenue.
Reduce costs
- In our Data Intelligence Usage Dashboard example, the most significant chunk of the costs is related to the creation process, we have to reduce the creation cost. For example, have fewer people involved.
- The compute cost on AWS can be decreased by optimizing the computation and requiring a smaller and cheaper instance or using spot instances as they are compatible with the nature of the job.
Increase revenue
- The most effective way to increase revenue is to increase the attribution rate. (As mentioned in the 8 step blog post, potential problems and new requirements are discussed in the monitoring stage of creating a data product. As we improve the data product and bring it closer to the demands of pre-sales engineers; therefore, the attribution rate increases.)
- Internal marketing to spread awareness of the data product to increase adoption.
- Add functionality to the tools using the data product. For example, is the data product telling a compelling story? Are all measures and KPIs clear to the data product consumers?
At Collibra’s Data Office, we are constantly working on improving our Data Intelligence. This means connecting the right people to the right data, insights, and outcomes. With this experiment, we’ve walked you through the steps to estimate the value of a data product via outcomes and costs related to maintaining and building it. Once you know how much your data products are worth, you can build a strategy to effectively build and deploy data products that bring the most value to your organization. Ultimately getting full value out of your data.
-

Sarvenaz Rahmati
Sarvenaz Rahmati
Collibra
-

Alexandre t'Kint
Alexandre t'Kint
Senior Product Manager AI Governance
Collibra
In this post:
Share on:
Related articles

Data IntelligenceJanuary 27, 2022
Accelerate IFRS-17 Compliance with Data Intelligence Platform
Data IntelligenceSeptember 27, 2022
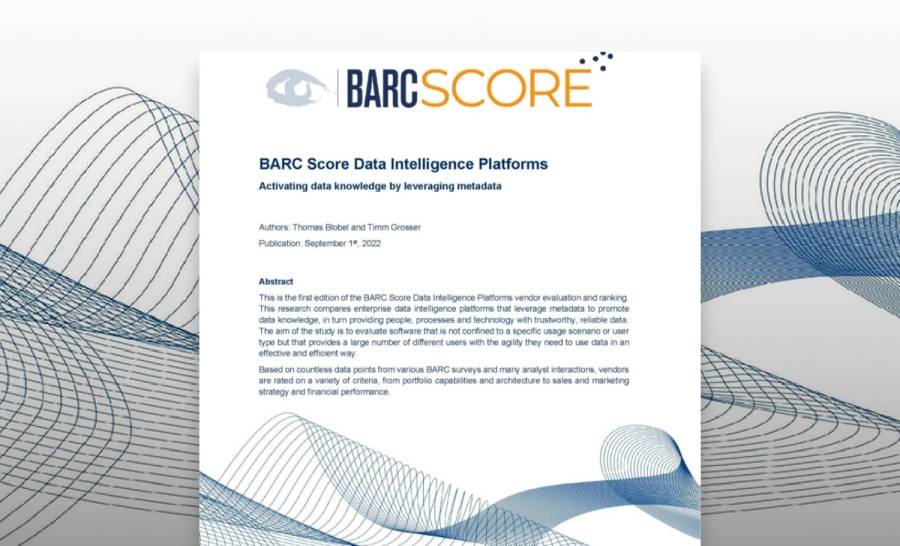
Collibra is a Market Leader in first-ever BARC Data Intelligence Platform Vendor Evaluation
Data IntelligenceOctober 28, 2022
The must-have checklist for maximizing the value of your data catalog and governance investments with Collibra

Data IntelligenceMarch 10, 2022
Improve data literacy and data sharing in government
Keep up with the latest from Collibra
I would like to get updates about the latest Collibra content, events and more.
Thanks for signing up
You'll begin receiving educational materials and invitations to network with our community soon.