Unification of data quality and observability with data and AI governance

Only 37% of data and AI executives said they have been able to improve data quality. Part of the problem is less than a third of organizations use a single, unified platform for governance, quality and observability. The use of fragmented governance, quality and observability tools increases administration and troubleshooting complexity, and creates redundant and manual workloads that drive up costs. Fragmented governance, quality, and observability tools make it difficult to cross reference causes and impacts with policy violations at every stage in the data flow so you can prioritize response based on business severity.
What's new: Collibra Data Quality & Observability
Data quality and observability functionality is fully unified with the Collibra Platform. Collibra Data Quality & Observability ensures data is fit for purpose – accurate, complete, and consistent. Collibra achieves this through automated profiling (e.g., analyzing behaviors, schema changes), defining and enforcing rules, and detecting specific issues like duplicates, patterns, and record deltas. This proactive approach identifies data inconsistencies and anomalies at their source, validating data integrity.
Data Observability provides deep visibility into the health and operational state of data pipelines and assets. It involves continuously monitoring data behaviors to detect unexpected changes, identifying anomalous outliers from established norms, and tracking performance through dashboards, scorecards, and alerts. Together, these capabilities allow organizations to not only fix existing data issues but also gain real-time insights into data reliability, enabling proactive issue management and ensuring trustworthy data for all downstream consumption.
How Data Quality and Observability helps
The majority of organizations have a data governance tool to define data quality standards, policies, business rules, metrics, regulatory requirements, and related stewardship processes and ownership. The management of technical data quality rules is handled in a completely different tool, often relying on a proprietary scripting language, or spreadsheets are used to track a patchwork of SQL and Python scripts. Finally, a third, separate tool monitors data for compliance with rules and metrics, identifying anomalies, causes, and impacts, and triggering alerts and notifications when problems arise.
Collibra Quality and Observability solves for:
Excessive technical workloads
- Managing data connections, permissions and users separately in each tool
- Manually stitching together technical and business lineage information across tools
- Manually integrating task queues, workflows and notifications between tools
Limited business visibility
- Manually mapping data quality scores to data catalog assets and governance policies
- Manually correlating alerts to identify causes and impacts
- Manually identifying the people accountable for issue management and assigning them tasks
How Data Quality and Observability works
Data Quality and Observability has many features that help stakeholders ensure data reliability such as:
Data Quality Job
A Data Quality Job is a group of columns from one or more tables that are evaluated by specific monitors and profiling actions. These monitors help you ensure the data within the job's scope is accurate and reliable for reporting and analysis.
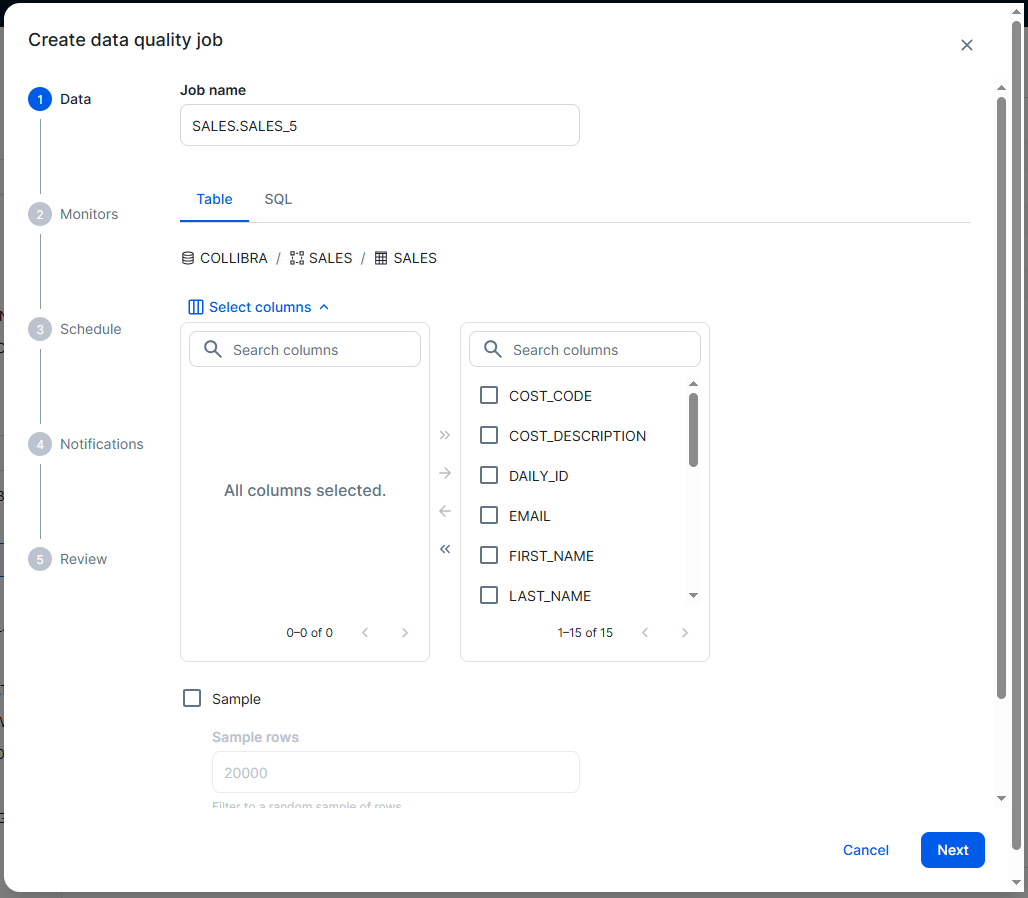
There are five quick steps to setup a data quality job
Data quality score
The data quality score is an aggregated percentage between 0 and 100 that summarizes the integrity of your data. A score of 100 indicates that Data Quality & Observability has not detected any quality issues, or that such issues are being suppressed. When a score meets the out-of-the-box or custom criteria to trigger a notification, Collibra sends a notification to the assigned recipients.
Depending on the scoring threshold, which consists of predetermined scoring ranges, a data quality score falls into one of the following scoring classifications:
- Passing: A data quality score higher than or equal to the upper-most scoring threshold. The out-of-the-box passing range is 90-100
- Warning: A data quality score between the passing and failing threshold. The out-of-the-box warning range is 76-89
- Failing: A data quality score lower than or equal to the lower-most scoring threshold. The out-of-the-box failing range is 0-75
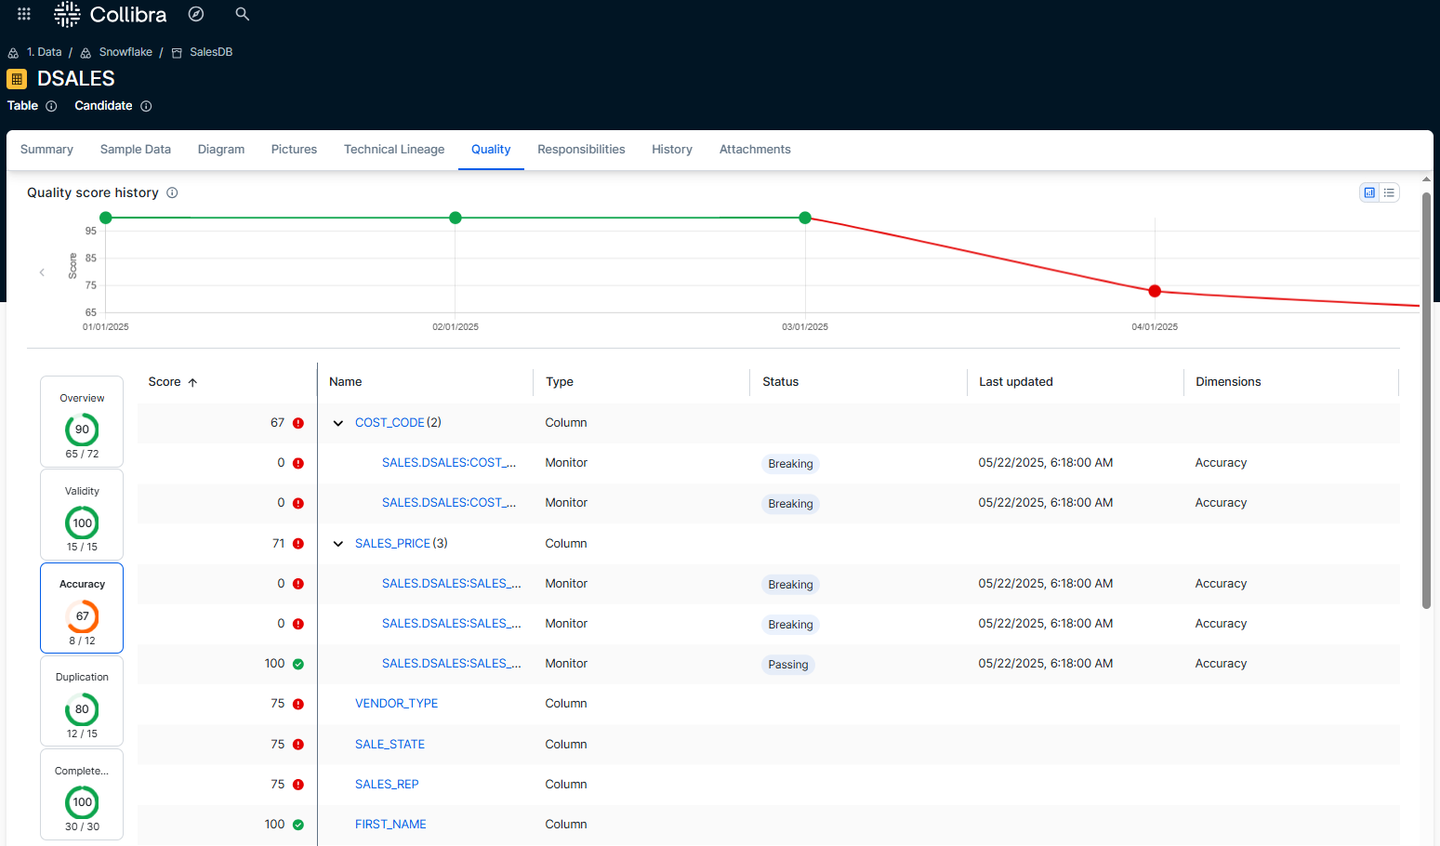
Quality scores are tracked over time
Data profiling
Data profiling provides a detailed analysis of your data's behavior and trends over time. It forms the foundation of a robust data quality and observability strategy.
When you run a Data Quality Job, the scan results include insights such as column-level statistics, charts, and other data quality and observability metrics. These insights help you identify common patterns and emerging trends, providing a better understanding of the structure and quality of your data.
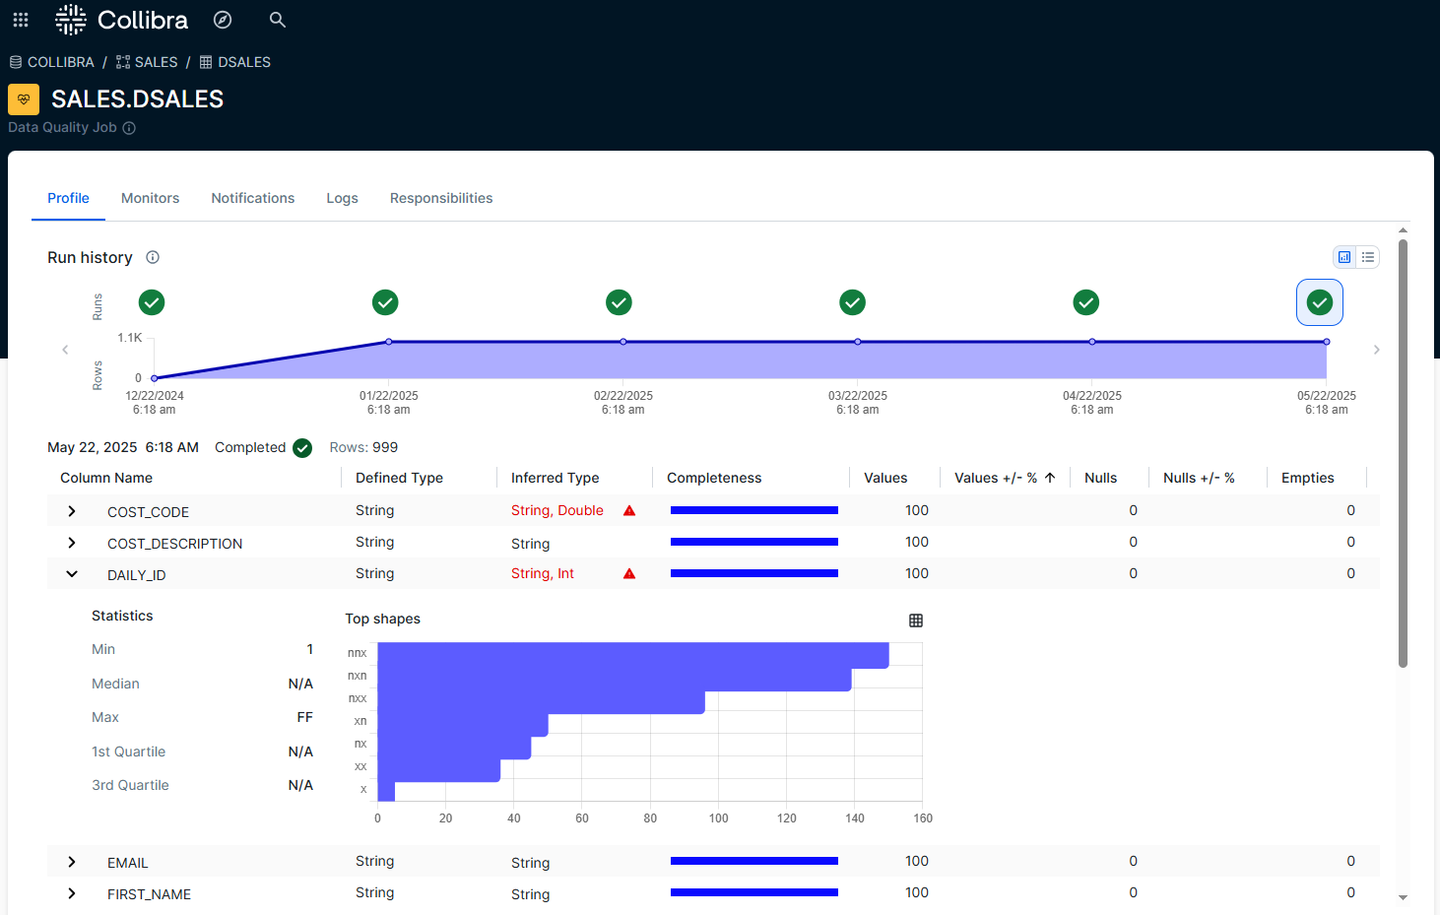
Understand data content and structure with profiling
Data quality monitors and dimensions
Data quality monitors are out-of-the-box or user-defined SQL queries that provide observational insights into the quality and reliability of your data.
Monitor types
- Schema change: Schema evolution changes, such as columns that are added, updated, or deleted.
- Data type check: Changes to the inferred data type for a given column.
- Row count: Tracks changes to the number of rows in the Data Quality Job.
- Uniqueness: Finds changes in the number of distinct values in a field in all columns.
- Null values: Detects changes in the number of null values in all columns.
- Empty fields: Finds changes in the number of empty values in all columns.
- Min value: Detects changes in the lowest value in numeric columns.
- Max value: Detects changes in the highest value in numeric columns.
- Mean value: Detects changes in the average value in numeric columns.
- Execution time: Tracks changes in the data quality job execution time.
Dimensions
Each monitor is associated with a default data quality dimension. Data quality dimensions categorize data quality findings to help communicate the types of issues detected.
Dimension types
- Accuracy: The degree to which data correctly reflects its intended values. Monitors associated with the Accuracy dimension: Min, max, and mean values.
- Completeness: The percentage of cells in a column that contain values identified as actual values, null, or empty. Completeness refers to the percentage of columns that have neither EMPTY nor NULL values. Monitors associated with the completeness dimension: Row count, null values, and empty fields.
- Consistency: The degree to which data contains differing, contradicting, or conflicting entries. Monitor associated with the consistency dimension: Execution time.
- Integrity: The legitimacy of data across formats and as it's managed over time. It ensures that all data in a database can be traced and connected to related data. Monitor associated with the integrity dimension: Schema change.
- Validity: The degree to which data conforms to its defining constraints or conditions, which can include data type, range, or format. Monitor associated with the validity dimension: Data type check.
- Duplication: The degree to which data contains only one record of how an entity is identified. Refers to the cardinality of columns in your dataset. Monitor associated with the duplication dimension: Uniqueness.
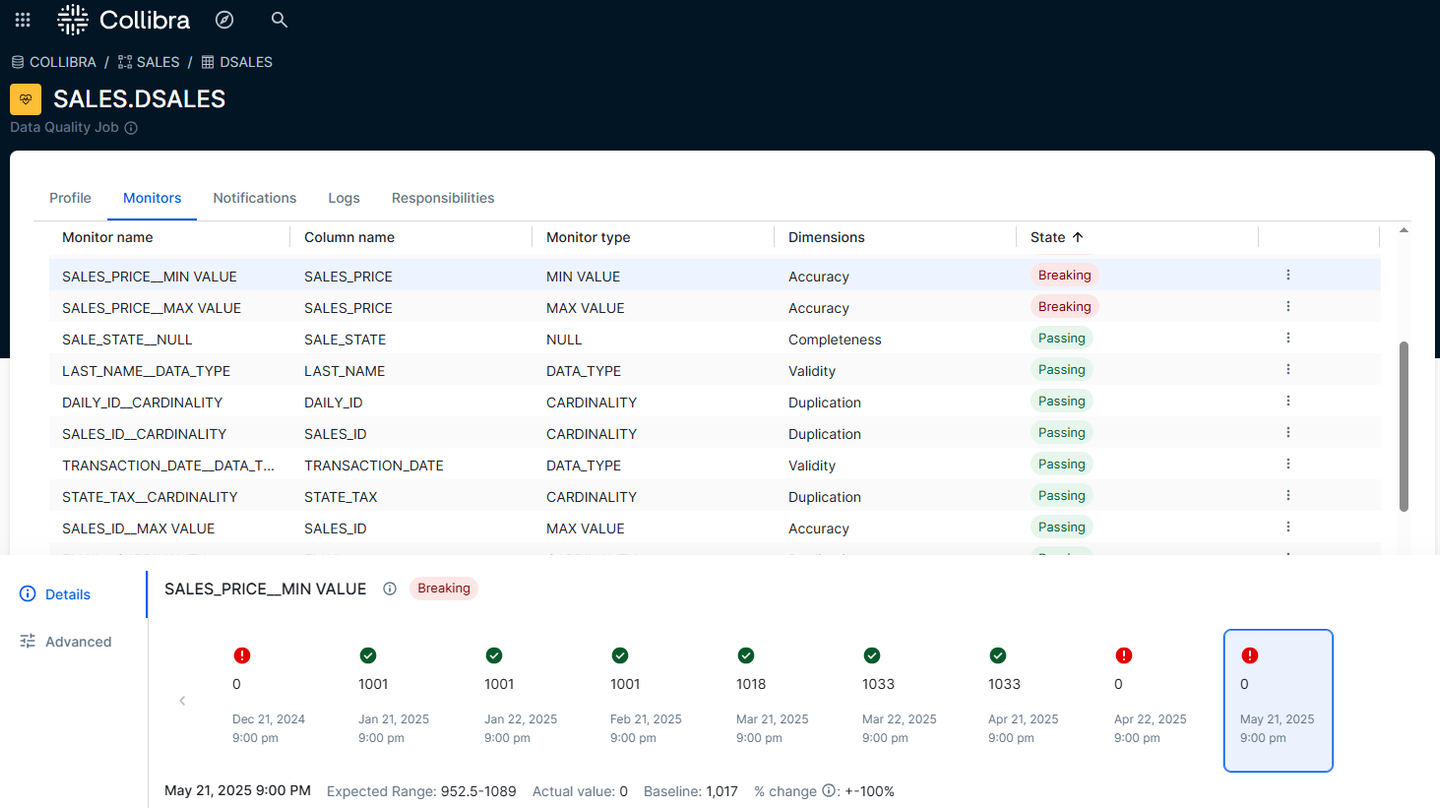
Apply multiple quality monitors to data assets
Notifications
Notifications are emails that alert users to data quality events and issues as they occur. To trust your data, it is essential to stay informed of potential data quality issues as soon as they are detected. You have full control over how notifications are configured.
You can configure notifications to alert relevant stakeholders to issues with a physical data asset, such as a failed job or a lack of data returning for a certain number of days despite successful job runs.
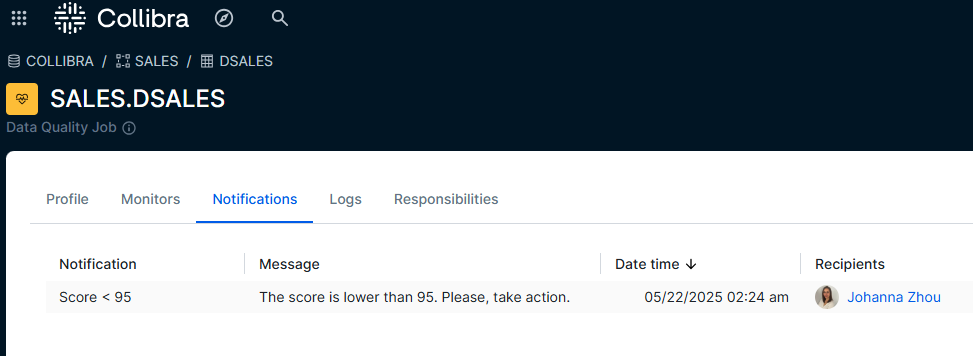
Proactively notify stakeholders of data quality issues
Scheduling
Schedules trigger a series of monitors to run automatically against a Data Quality Job at specified intervals. You can set schedules to run hourly, daily, weekly on specific days and times, on weekdays, or monthly. Schedules ensure automated data quality coverage without the need for manual intervention on a given date.
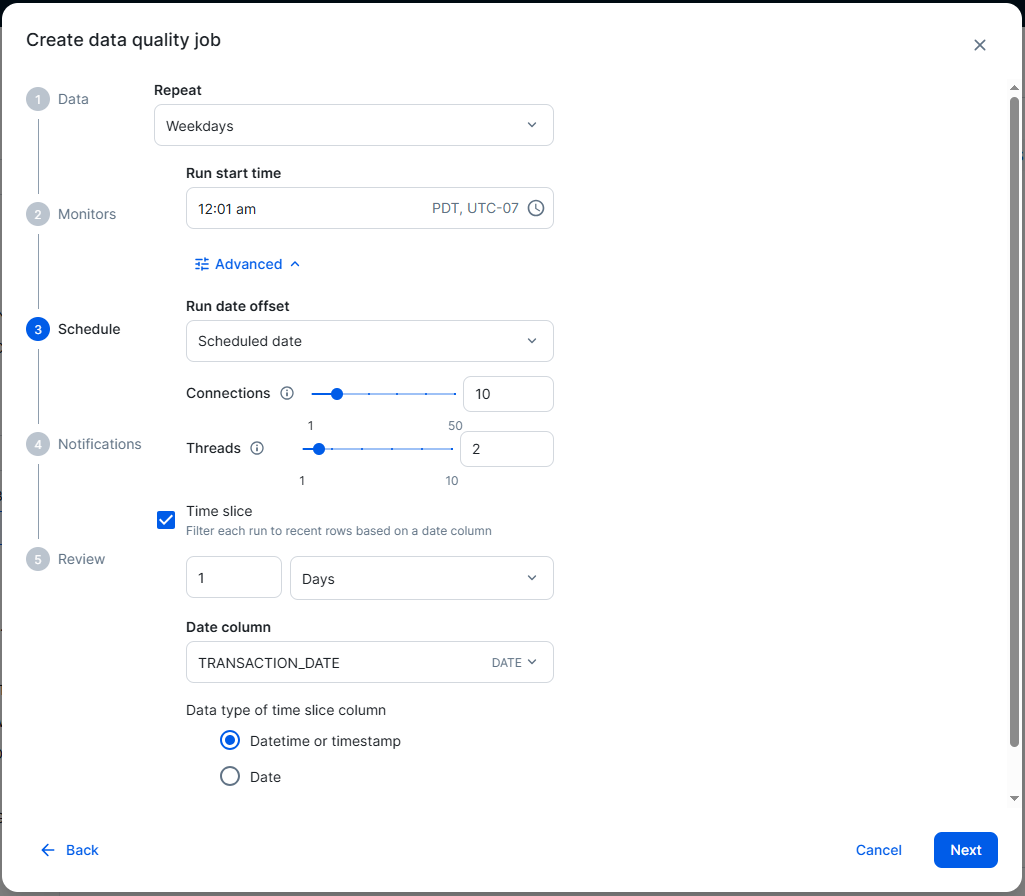
Schedule jobs to run at specified intervals
Data Quality Score Aggregations
A data quality score aggregation is a chain of relations from the target asset to the source of the data quality score that instructs Collibra how to calculate scores. Scores from Column and Table assets are automatically aggregated out-of-the-box.
Quality score aggregations allow you to:
- View data quality scores on physical data assets in Data Catalog.
- View data quality scores on Business, Data, and Governance assets.
- Control how data quality is compiled across assets.
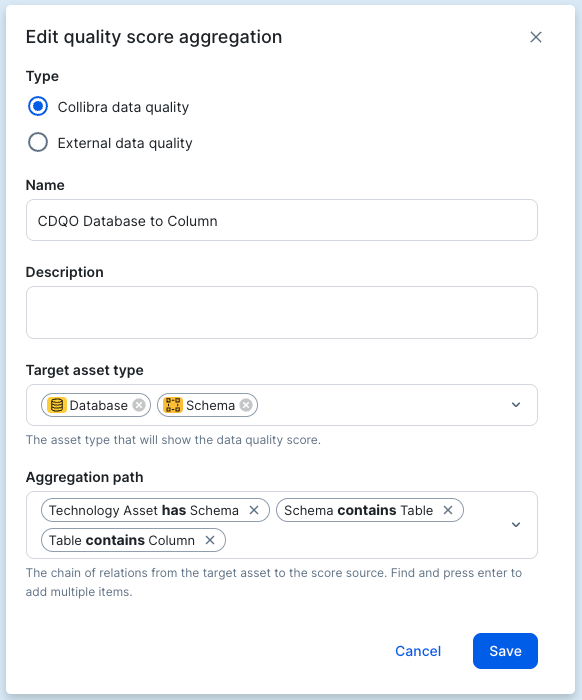
Define how data quality scores map to catalog assets
[caption id="attachment_18341" align="alignnone" width="582"] Define how data quality scores map to catalog assets[/caption]
In the example above, values from Column Assets are aggregated for Database Assets by looking up:
- The Schema Assets that these Database Assets have.
- The Table Assets that these Schema Assets contain.
- The Column Assets that these Table Assets contain.
Why you should be excited
Data Quality and Observability helps users across the organization from data stewards to business analysts:
- Data stewards: Proactively monitor, enforce, and improve data quality policies, with prompt issue identification and notification
- Data engineers: Gain proactive alerts on data quality and pipeline issues, to build more reliable and efficient data flows
- Business analysts: Confidently access and trust data knowing its quality and freshness are continuously monitored

Data Quality and Observability helps these personas ensure data reliability across the organization through two distinct use cases: speeding up data quality monitoring and increasing data confidence.
Speed data quality monitoring
You can use quick monitoring to deploy basic Data Quality Jobs in one click across an entire schema. All tables in a schema are included and a sample number of rows that you specify are profiled in each table to provide the descriptive statistics. This helps you understand the contents of your tables before applying advanced data quality monitoring.
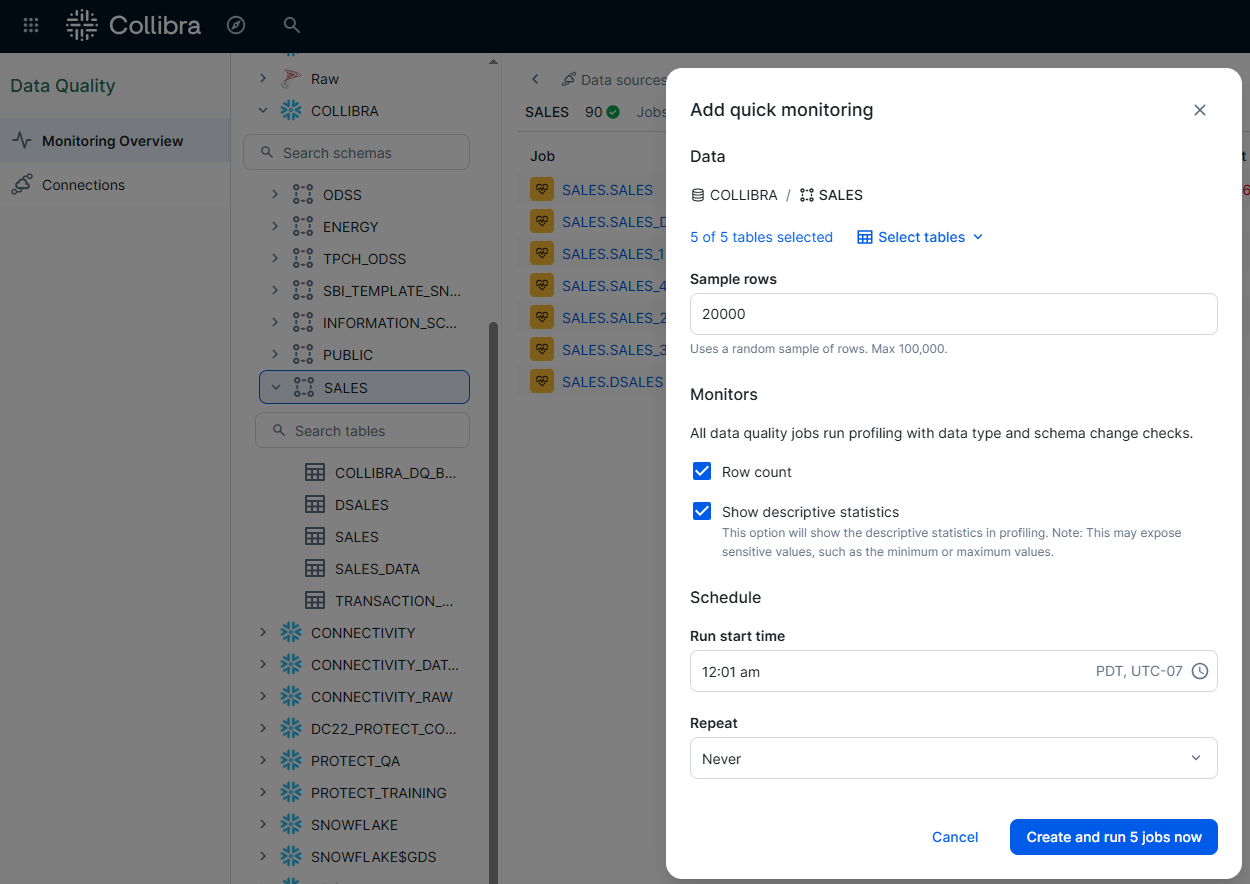
Deploy monitoring across an entire schema
Increase data confidence
Transparence of data quality scores increases confidence in the use of data. Data consumers can select an asset in the catalog and get complete visibility of which columns are being monitored, the status of and scores for the column, and who is responsible for managing the quality of the asset.
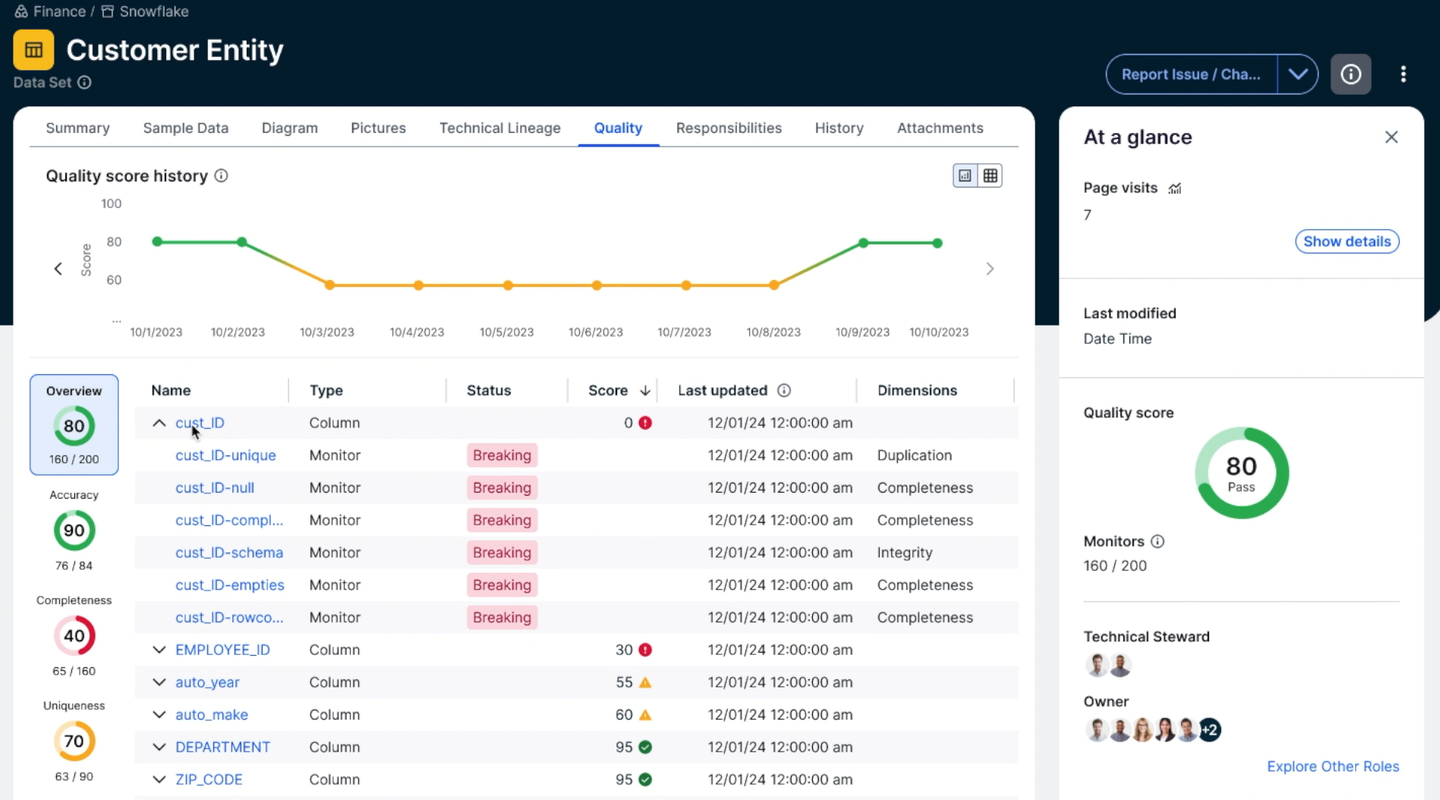
Provide data quality visibility within the data catalog
Key takeaways of Data Quality and Observability
Experience the “Power of One” for your data and AI governance needs. Speed data quality monitoring by reusing your connections to Snowflake, Databricks, BigQuery, Athena, Redshift, Trino, SQL Server and SAP HANA already defined in Collibra Platform to setup and run data quality jobs. Increase confidence in data by automatically aggregating data quality scores from different rules to an overall score for assets in the data catalog. Improve efficiency in administration by centrally managing users, roles and permissions and enabling all users to have a single login to all products in the platform.
Watch our Data Quality and Observability demo to see the "Power of One" in action.
Unification of data quality and observability with data and AI governance
- Speeds deployment and return on investment
- Decreases technical workloads for data quality and governance
- Increases business visibility of data quality and governance
Where to learn more about Data Quality and Observability
Check out these three resources to learn more:
Related articles

Data QualitySeptember 12, 2024
What is data observability and why is it important?

AIJuly 15, 2024
How to observe data quality for better, more reliable AI
Data QualityNovember 8, 2024
Announcing Data Quality & Observability with Pushdown for SAP HANA, HANA Cloud and Datasphere

Data QualityNovember 16, 2023
The data quality rule of 1%: how to size for success
Keep up with the latest from Collibra
I would like to get updates about the latest Collibra content, events and more.
Thanks for signing up
You'll begin receiving educational materials and invitations to network with our community soon.


