The end of governing "everything": A smarter approach with Data Usage

66% of organizations report that at least half of their enterprise data remains unused or "dark," according to Google Cloud’s 2024 Data and AI Trends Report.
Collibra's new Data Usage capability is designed to directly address this challenge by shining a light on that "dark data," providing clear insights into which assets are actually being used and which are not
What’s new: Data Usage
We are excited to introduce Data Usage for Snowflake, a powerful new capability designed to bring clarity and focus to your data strategy. At its core, this feature provides real-time, actionable insights into how your data is consumed within your Snowflake environment, answering the critical question: ‘Which data truly matters to our business?’ By analyzing query history to pinpoint the most frequently used tables and columns, it takes the guesswork out of data management and allows your teams to prioritize with confidence.
How Data Usage helps
In today's vast data landscapes, governance teams often face an impossible choice: try to govern everything at once or risk letting critical data fall through the cracks. Without clear insight into which data is actually being used, teams waste valuable resources on low-value assets while cloud costs escalate and data sprawl goes unchecked. This lack of visibility makes it incredibly difficult to prioritize data quality efforts, optimize performance, and focus governance where it will have the most significant business impact, leaving teams guessing where to even begin.
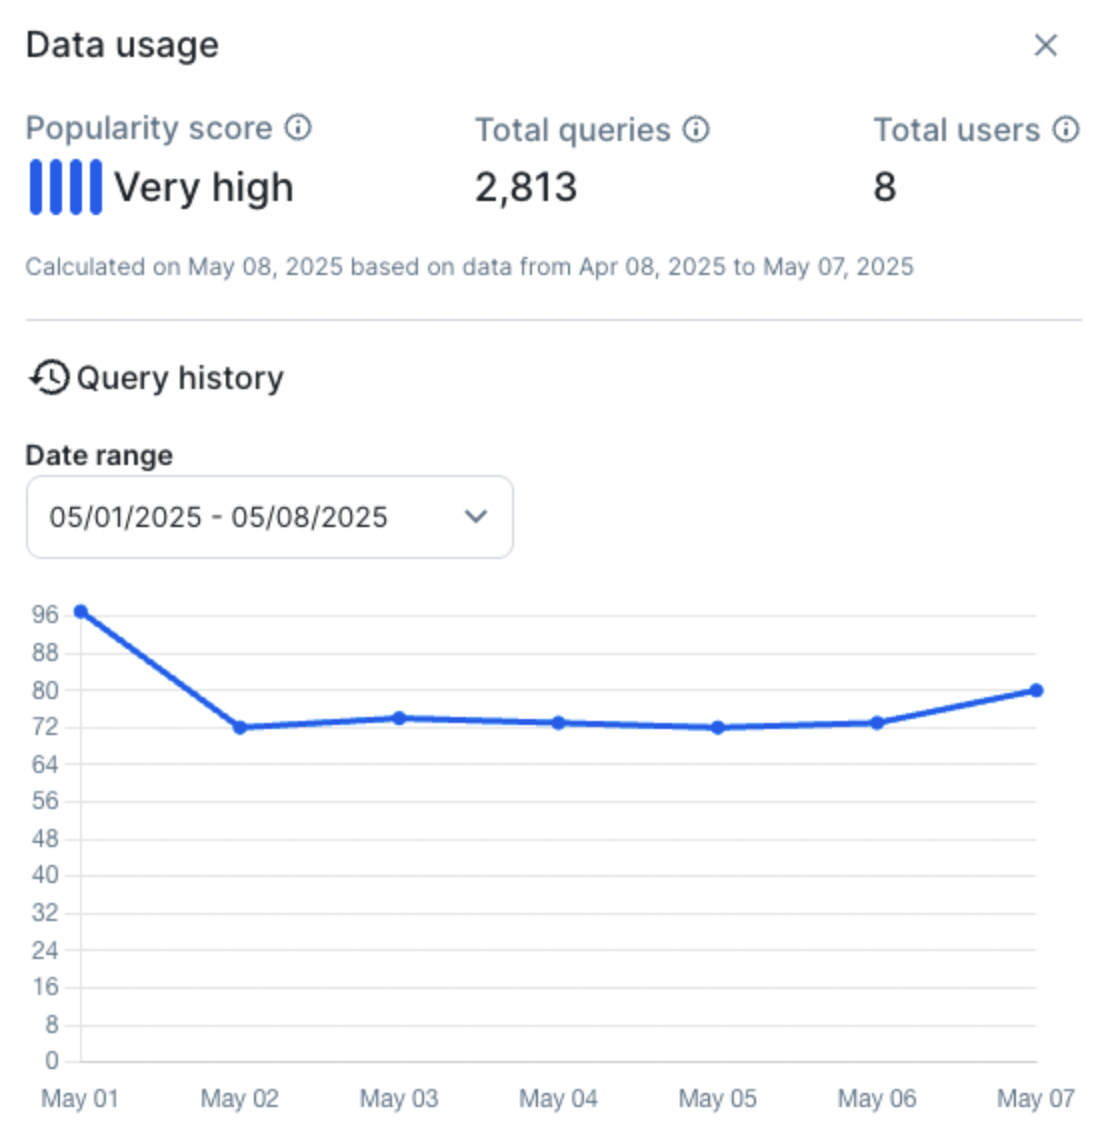
Assess data relevance in seconds with key usage indicators such as Popularity Score, query counts, and total user counts.
Data Usage solves for:
- Inefficient governance and Data Quality efforts: Without knowing what data is actually being used, teams often try to govern everything at once ("boil the ocean"). This leads to wasted time and resources spent cleaning, documenting, and applying policies to data that provides little to no business value. Data usage insights solve this by pinpointing the most popular and critical assets, allowing teams to prioritize their efforts for maximum impact
- Difficulty in measuring the value of data assets: It's hard to justify continued investment in data management and governance without being able to demonstrate the value of data. Data usage metrics provide a tangible way to show which data assets are most valuable to the business, helping to prove the ROI of data initiatives and guide future investments
- Data sprawl and redundancy (ROT Data): Over time, data platforms accumulate redundant, obsolete, and trivial (ROT) data. This not only increases storage costs but also creates confusion for users, who don't know which version of the data to trust. Data usage analytics help solve this by identifying unused or duplicative tables and assets that can be archived or decommissioned, decluttering the data landscape
How Data Usage works
Data Usage is a core feature designed to enrich Collibra Catalog metadata by providing insights into how data assets are used. For Table, Database View, and Column assets, it captures queries_count and users_count at a minimum daily interval, storing historical data for up to six months.
A 'Popularity Score' is calculated for the last 30 days using a specified formula, then percentile-ranked into five distinct categories: None, Low, Medium, High, and Very High. This score, along with Total Queries and Total Users from the last 30 days and a query history graph, is prominently displayed on the Asset page within the Catalog UI, enhancing the 'At the Glance' section.

Why you should be excited
Data Usage helps people across the organization from data product owners to data stewards:
- Data Product Owners: Data Product Owners can now leverage usage insights as a powerful feedback loop to guide their development roadmap. They can easily see which specific tables and columns are most frequently used and by which teams, allowing them to focus improvement efforts on the data that delivers the most value. Furthermore, with AI-powered analysis of top queries, they can uncover the underlying business needs driving consumption, ensuring future product iterations are perfectly aligned with real-world user requirement
- Data Consumers: Usage insights act as a powerful signal of trust and relevance, allowing Data Consumers to select data with much higher confidence. Seeing that a particular dataset is popular, actively used by many others, and maintained by its producers provides strong social proof of its reliability and business value. This helps them move faster from discovery to impactful analysis, knowing they are working with proven and relevant information.
- Data Stewards: For Data Stewards, usage insights provide a data-driven way to prioritize their immense workload and maximize their impact. By using a popularity score, they can strategically focus on enriching metadata, applying data quality rules, and certifying the assets that are actually being used by the business.
Data Usage helps with use cases such as:
Data Products: Identify most used Tables in Data Product using Data Marketplace.
Data Marketplace admin can build a Popularity Score relation index and make it as a Search Facet so that Data Product owners can identify the most used Tables in their Data Products.
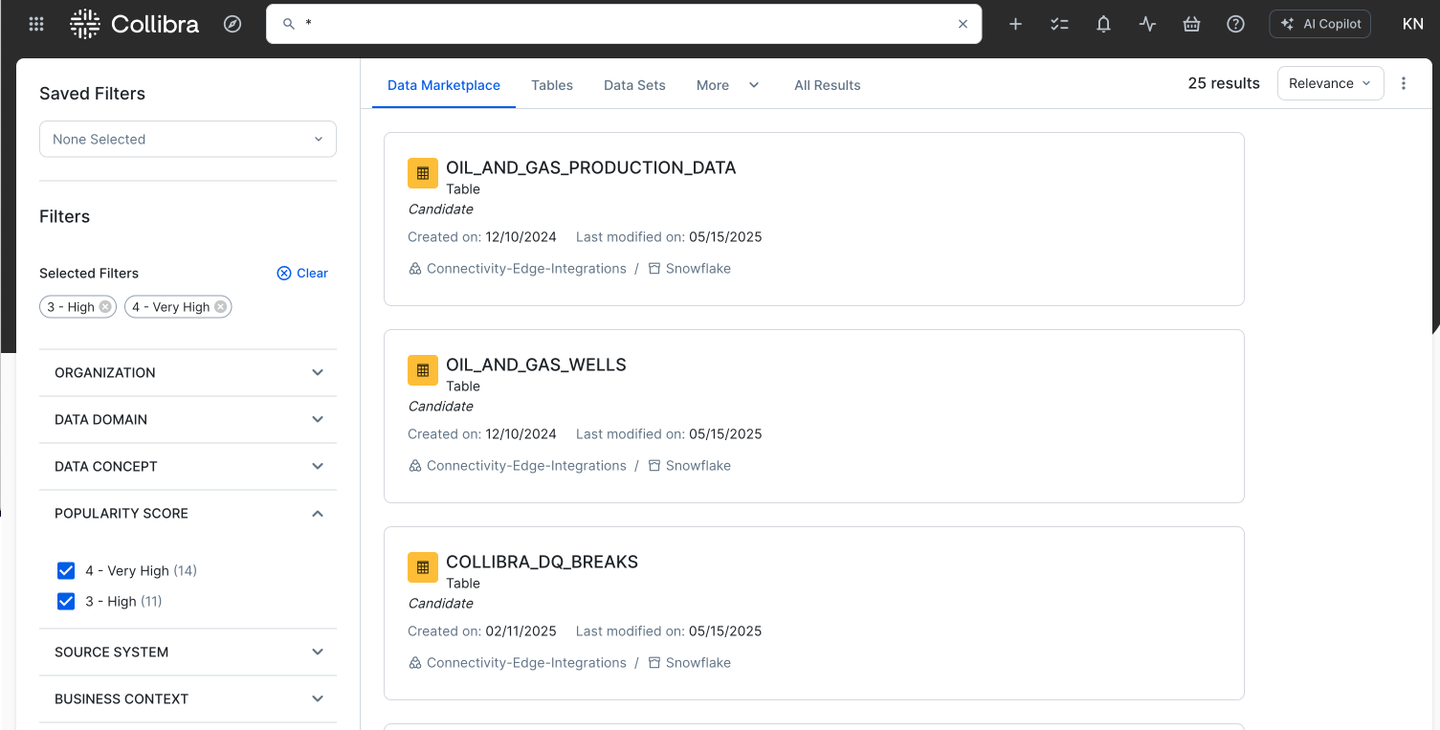
Pinpoint your most-used tables and optimize your data products by filtering with the “Popularity Score” facet in the Data Marketplace.
Data Steward: Identify not used Tables using Asset views
On the “Catalog Data Sources” page users can filter by the “Popularity Score” attribute to identify unused tables.
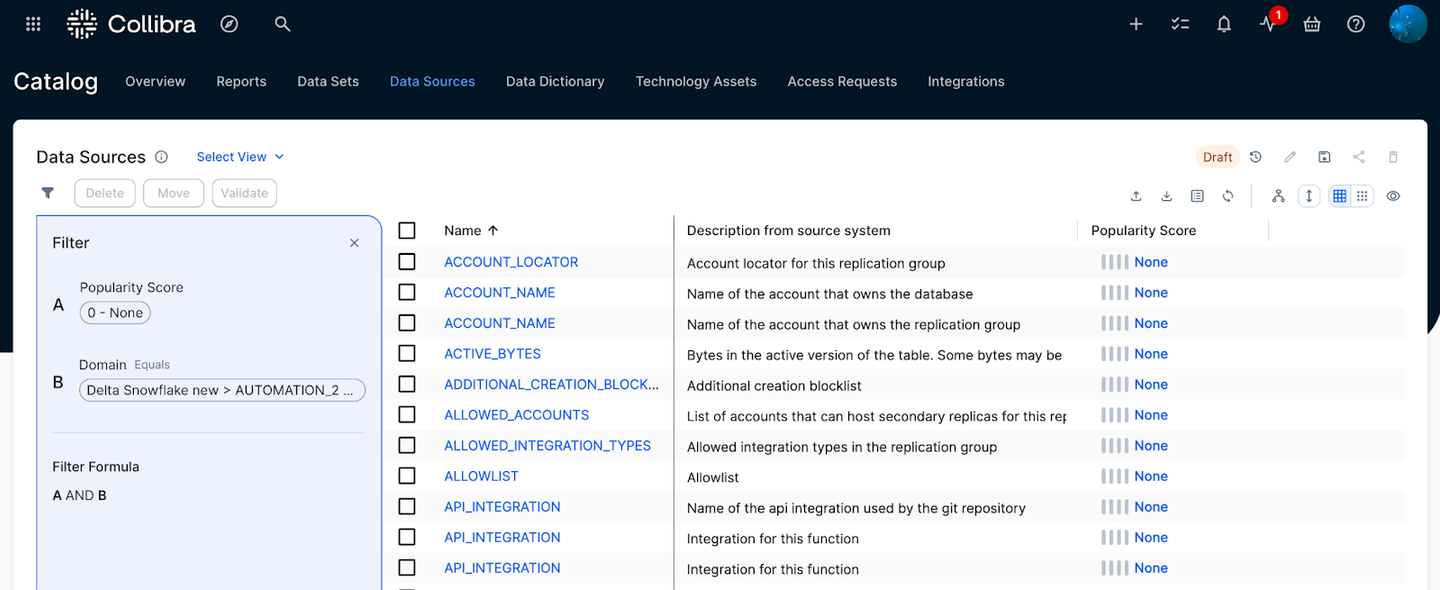
Data Stewards can quickly find unused tables by filtering their asset views for a low “Popularity Score.”
Key takeaways about Data Usage
The new Data Usage capability perfectly exemplifies the "Power of One" by creating a single, unified view of a data asset's true business value. By integrating real-world consumption data from platforms like Snowflake directly into Collibra, we bridge the gap between technical usage patterns and rich business context. This provides one definitive source of truth for prioritization, allowing all data teams to align their efforts and operate as one. Ultimately, it ensures that your most valuable data receives the focus it deserves, all managed and understood within one intelligent platform.
Catch up on our June launch announcements by watching the full recording here. Watch the on-demand webinar to learn:
- The latest innovations in Collibra’s data and AI governance platform
- How Collibra’s Data Usage helps answer the questions about your data assets: Which data is most valuable? Where should we focus our efforts? Which datasets are critical for business operations?
- How to get started
Where to learn more about Data Usage
Ready to get started? Read our documentation.
Related articles
Data GovernanceFebruary 14, 2025
Why we are the data and AI leader for you
Data GovernanceJuly 28, 2025
Your new shortcut to trusted data: Collibra’s two-way Slack Integration

Data GovernanceMay 24, 2022
The journey to data catalog and governance success: A customer perspective

Data GovernanceOctober 12, 2023
Improved user provisioning leads to calmer seas and smoother sailing
Keep up with the latest from Collibra
I would like to get updates about the latest Collibra content, events and more.
Thanks for signing up
You'll begin receiving educational materials and invitations to network with our community soon.


